this post was submitted on 05 Jun 2024
144 points (100.0% liked)
covid
829 readers
3 users here now
Try to include sources for posts
No Covid misinformation, including anti-vaxx, anti-mask, anti-lockdown takes.
COVID MINIMIZATION = BAN
This community is a safe space for COVID-related discussion. People who minimize/deny COVID, are anti-mask, etc... will be banned.
Off-topic posts will be removed
Jessica Wildfire's COVID bookmark list
COVID-safe dentists: (thanks sovietknuckles)
- https://covidsafeproviders.com/category/covid-safe-dental-dentists/
- https://www.covidsafedentists.ca/
- https://www.covidmeetups.com/en/directory/dentists/US
New wastewater tracking (replacing biobot): https://data.wastewaterscan.org/tracker
founded 2 years ago
MODERATORS
you are viewing a single comment's thread
view the rest of the comments
view the rest of the comments


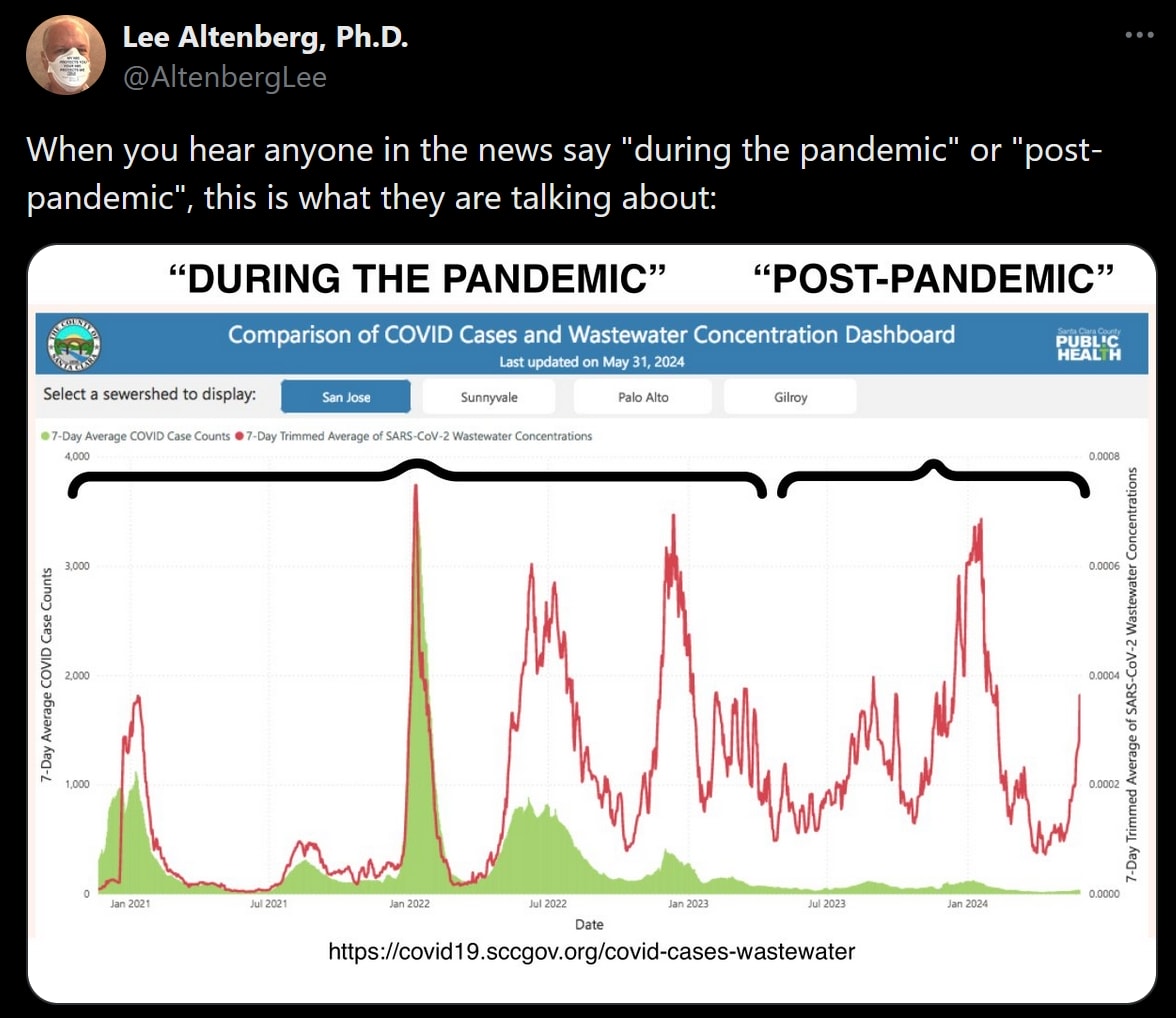
The graph at the top is odd. It's specifically from Santa Clara County, CA. The biobot data nationally, and in my region never looked like that. i.e. the waves following omicron were much more mild in concentration.
Here's another showing the January wave, with the current uptick still very small in comparison. Makes me curious what's up with SCC's data. Maybe they didn't capture the omicron wave very well in their rolling average? It looks like a single data point at the peak. If that wave wasn't captured well it'd cause the following waves to look anomalously larger after scaling to case numbers.
The more you zoom out, and the longer this has gone on, the less data points we've had resulting in far less accuracy when averaged at greater scale. At a county level, there's been traveling spikes moving throughout the country in unmonitored counties that are basically feeding the surrounding areas and keeping the floor raised.
Also as this has gone, and with the variety of variants, the synchronicity between people's immunity to any specific variant has become wildly out of step. So you get half your population immune during one wave, and then a few months later their population wanes and you see a sudden spike because the next county over caused an outbreak in your now immune less population.
I'm afraid I don't have the screenshots for it anymore but a really good example was in Monroe county Florida they began monitoring out of nowhere, and then suddenly spiked higher than anything the neighboring (and well populated) miami-dade county saw the entire pandemic. Monroe county (and eventually Miami-Dade) then stops monitoring and we have no clue what's happening down in that area of Florida.
Anyway tldr, the raised floor we're seeing is being sustained by the unmonitored counties spiking that we're not seeing.
Oh, I do have Seminole county which did something similar, but we had much more data. Seminole County neighbors Orange County (Disney, etc) and popped higher than any recorded data we had the Disney area.
Here's when I noticed Monroe county spiking and saved some of the data. https://hexbear.net/comment/3919179
what a shitshow
Oh, this is embarrassing, but you spelled 'most efficient system' wrong.