[Administrative] Community moderation
(lemmygrad.ml)
2
39
6
12
The following article, which shows the sharply rising proportion of fixed investment in the economy in the 250 years since the Industrial Revolution, was written in the context of a specific discussion of China’s economy. This is the claim that China invests too high a proportion of its economy. As the article shows, on the contrary, China’s approximately 40 percent of gross fixed investment/gross fixed capital formation in GDP is merely the latest stage of a process that has been going on for over two centuries. Such a deep process has, of course, profound implications for economic policy—as the article analyzes.
However, the data in this article relates to more general theoretical issues as well as the specific discussion of China. The rising proportion of the economy used for investment is one of the most central predictions of Marx’s Capital—or, as he terms it, the “rising organic composition of capital.” Such a rising proportion of investment in the economy was, less systematically, also predicted by Adam Smith, and by, for somewhat different reasons, by John Maynard Keynes. The attempt by Milton Friedman to refute this was found to be erroneous, even by neoliberals, thanks to modern econometric studies, as discussed below.
In light of this, it is therefore rather astonishing that attempts have been made to refute Marx on the rising organic composition of capital by some of those who claim to be presenting Marx. These critics argue that there is no reason why the proportion of investment in the economy should rise, and that subsequent theoretical work has shown that there is a pattern of technological change between the two sectors (wage goods and means of production) that can keep the ratio of consumption and investment steady in perpetuity.
Such claims mean that, from a theoretical viewpoint, such authors do not understand Marx’s economics. That, however, can be dealt with in a separate article. For present purposes, the issue is one of facts: the rising proportion of investment in the economy is a factual question that can be measured.
In Marx’s analysis, constant capital consists of two parts—circulating capital, which, in modern Western economics, would be termed “intermediate products,” and fixed investment. Factual studies confirmed that the most rapidly growing component of the economy is intermediate products/circulating capital. Thus, for example, in the United States, Jorgenson, Gollop and Fraumeni found: “the contribution of intermediate input is by far the most significant source of growth in output. The contribution of intermediate input alone exceeds the rate of productivity growth for thirty-six of the forty-five industries.”[1]
The same result is found for other economies, including China. For South Korea, Hak K. Pyo, Keun-Hee Rhee, and Bongchan Ha found that regarding intermediate inputs, “the relative magnitude of contribution to output growth is in the order of: material, capital, labor, TFP then energy.”[2] For Taiwan Province of China, analyzing twenty-six sectors in 1981–99, Chi-Yuan Liang found regarding intermediate material inputs were “the biggest contributor to output growth in all sectors during 1981–99, except…seven.”[3] For mainland China, Ren and Sun found that, from 1981 to 2000, subdivided into 1984–88, 1988–94, and 1994–2000, “intermediate input growth [was] the primary source of output growth in most industries.”[4]
However, although the evidence is that circulating capital/intermediate products rises more rapidly than both GDP growth and fixed investment, nevertheless, the facts are clear that there is historically a massive increase in the proportion of fixed investment in the economy—from around 3 percent of GDP in Britain at the time of the Industrial Revolution to 40 percent of GDP in China today. That is, there is also a massive increase in the proportion of the production of means of production in the economy. The facts show a massive increase in the organic composition of capital with economic development. Therefore, not only is it theoretically erroneous that some claiming to represent Marx align themselves with Friedman against Marx, Smith, and Keynes; more importantly, their claims are also entirely against the economic facts.
The data in the article below, which was originally published in Chinese by Guancha, therefore extends beyond the specific issue of China’s current development, to fundamental economic theories of development. Marx’s analysis of the rising proportion of the economy used for investment—that is, the rise of the proportion of the economy used for production of production—is one of his greatest achievements and entirely confirmed by 250 years of economic development, including by the 150 years since Marx accurately predicted it.
–John Ross
China’s very high level of investment reflects the historically advanced character of its economy
Accurate analysis of the role of investment in economic development is decisive for China, as it is for every country. The facts that follow confirm this. This applies not only to short-term economic policy but still more clearly to economic strategy—therefore, in particular, to China’s achievement of its goals for 2035 and 2049.
A false claim, a myth, however, is put forward in some sections of the Western media which attempt to obscure such an accurate assessment. This is the claim that China invests too high a proportion of its economy because its level of investment in GDP is much higher than that of Western countries. But in reality, as will be seen, the entire historical period of development since the Industrial Revolution—that is, since the creation of modern economies—has seen progressively higher ratios of investment in GDP. Each successive period has, in turn, been associated with higher economic growth rates. The facts show that China’s high level of investment is simply the latest stage of an international process of economic development that has been underway for over two centuries.
Once this fundamental historical trend is understood, it becomes clear that China’s higher investment rate relative to Western economies is not a problem for China’s economy. On the contrary, it reflects its historically advanced economic structure. China’s gross fixed investment accounts for approximately 40 percent of its economy, whereas the United States’ is only slightly over 20 percent. In the even more important measure of net fixed investment, which takes into account depreciation, China invests 16 percent of its GDP, whereas the United States invests only 5 percent.
As the historical trend below demonstrates, the reason for the difference between China and Western economies is that the level of investment in Western economies is too low for the present global historical stage of economic development. This results in slow growth and consequent social and political instability. In contrast, China’s higher level of investment reflects that it is today the leading part of a process that has been going on since the Industrial Revolution.
The conclusion of this article will consider the implications of this historical trend of the rising proportion of investment in the economy, the faster growth rates that it gives rise to, analysis of the reasons for this trend, and the latter’s policy implications. It will be seen that this trend of the rising percentage of investment in GDP is entirely as predicted by Marx’s analysis of the increasing organic composition of capital—that is, the increasing capital intensity of production.
First, however, before analyzing the implications and following the method of “seeking truth from facts,” the data regarding the historical trend of the rising proportion of the economy used for investment will be clearly established.
Both historical and short-term analyses of the role of investment are consistent
Earlier articles by the present author on these issues used relatively sophisticated econometric methods to analyze the extremely close relation between investment and economic growth over relatively short time frames.[5] This was necessary because, during short time frames, economic growth may be affected not only by the most powerful long-term structural trends that determine an economy’s strategic development, but also by many purely short-term conjunctural fluctuations—business cycles, the impact of non-economic events, and so on. To use an analogy: in examining a short timeframe, it is difficult to distinguish the “signal” from the “noise,” necessitating the use of precise statistical methods to identify the underlying trend amid short-term fluctuations.
In this article a different, simpler method is used to show the clear trend of the rising proportion of investment in the economy. Over long timeframes, short-term, non-fundamental, peripheral, and secondary fluctuations have little effect, and only the most powerful processes dominate, allowing them to be clearly seen without the need for sophisticated econometric techniques. It is therefore hoped that this article, which requires no advanced statistical methods, will make clear to non-specialist readers the fundamental facts regarding the historically rising share of the economy allocated to investment.
It should be made clear, however, that these immediately visible trends neither replace nor contradict the statistical methods used in short-term studies. On the contrary, the two arrive at precisely the same conclusion. The longer-term historical studies provide the context within which the shorter-term processes operate.
The fundamental historical trend
To outline the most fundamental trend first, before considering individual countries in detail, Figure 1 shows the percentage of fixed investment—gross fixed capital formation, to be precise—in GDP in the lead economies in each period of economic development in the approximately 250 years since the Industrial Revolution. The “lead economy” is the major economy which had the fastest rate of economic growth during successive historical periods of economic development—that is, the economy which represented the growth frontier of these successive historic periods.
Figure 1_ _
_
Figure 1 immediately makes clear that in each successive period, the lead economy had a higher proportion of fixed investment in the economy than the previous one—it will also be shown that each lead economy had a higher sustained growth rate than the previous one.
These lead growth economies, in successive chronological order of their development, were Britain; the United States; West Germany; Japan and South Korea; and China.
As Figure 1 shows, each of these successive lead economies had a higher level of investment in the economy than the one before. This began with Britain, with investment of about 3 percent of GDP at the time of the Industrial Revolution, then rising to 10 percent by the 1830s, followed by gross fixed capital formation of slightly over 20 percent in the United States after the Civil War, then 30 percent in postwar West Germany, over 35 percent in Japan and South Korea, and rising to slightly over 40 percent in China today.[6] It is therefore clear that China’s high level of investment is simply the continuation of a process which has been taking place for 250 years since the Industrial Revolution.
The increasing rate of economic growth
Turning to the growth rates accompanying these increasingly high percentages of fixed investment, the successively faster economic growth rates in each of these periods are shown in Figure 2.
As what is important for fundamental economic development is sustained growth rates, not unsustainable and purely short-term spurts, long-term growth rates are considered here. To be able to make an exact comparison with China since the beginning of Reform and Opening Up, what is considered in each case is the maximum total economic growth achieved over a forty-six-year period during a country’s period of global economic growth leadership (i.e., a period equivalent to China’s growth in 1978–2024). In descending order of growth rate, which is also reverse chronological order, China’s is the fastest, then South Korea, then Japan, then West Germany, then the United States, then the United Kingdom.
Figure 2_ _
_
Table 1 summarizes these growth rates, showing both the total growth over a forty-six-year period of each of these lead economies and its annual average growth rate during that period. Thus, during its period of global growth leadership, the United Kingdom, the first country to experience the Industrial Revolution and create a modern economy, achieved 2 percent average annual growth, the United States achieved 4.8 percent, West Germany 5.3 percent, Japan 6.4 percent, South Korea 8.4 percent, and China 8.9 percent.[7]
The relation between this percentage of fixed investment in GDP shown earlier and the rate of growth is, of course, one to one. That is, the higher the percentage of fixed investment in GDP the faster the rate of economic growth. In terms of historical development, each historical period saw both a higher level of fixed investment in GDP and a higher rate of GDP growth than the one before.
This data therefore makes very clear that what has been taking place is a 250-year process since the Industrial Revolution of an historically increasing percentage of fixed investment in GDP and an increasingly fast rate of economic growth with progressive economic development. China’s level of investment in GDP (the highest of any major lead economy) and its fast growth rate (the most rapid of any major economy in human history) are therefore not an aberration, but simply the latest stage of this 250-year-long process.
Having shown the overall historic process, each of these lead economies will now be considered in detail—culminating with China.
Table 1
| 46-year GDP Growth Period China data is 1978–2024. Other states are maximum 46-year growth period after they became the leading growth economy |
|  | Year when it became leading growth economy | Maximum 46-year growth period | Total maximum growth in 46 years | Maximum annual average growth in 46 years |
| United Kingdom | 1760 | 1794–1840 | 148 percent | 2.0 percent |
| United States | 1840 | 1844–1890 | 768 percent | 4.8 percent |
| West Germany | 1946 | 1946–1992 | 976 percent | 5.3 percent |
| Japan | 1947 | 1947–1993 | 1,630 percent | 6.4 percent |
| South Korea1 | 1956 | 1956–2002 | 4,323 percent | 8.4 percent |
| China | 1978 | 1978–2024 | 4,907 percent | 8.9 percent |
| 1\. Peacetime growth, excludes Korean War Sources: See text of the article. |
Britain: The first industrial economy
Britain, the first economy to achieve industrialization, raised its level of investment from around 3 percent of GDP on the eve of the Industrial Revolution to 10 percent by the 1830s (see Figure 3), achieving an economic growth rate of 2.3 percent by the end of this period.[8]
Figure 3
During the 18th century and the beginning of the 19th century, Britain experienced economic acceleration, accompanied by introduction of radical new technologies and an increase in the percentage of fixed investment in GDP. [9] By the beginning of the 1820s, Britain had become the largest Western economy (i.e., excluding China and India), but with a per capita GDP almost four times that of China or India.[10] By this process Britain became the first modern industrial state and the world’s most advanced economy.[11]
The percentage of investment in England’s GDP was rising, initially extremely slowly, from the earliest periods for which data exists.[12] The most detailed recent study concludes: “the fixed investment ratio fluctuated at a low level of one to two per cent during the medieval period, increasing to between 2 and 4 per cent during the early modern period. However, the major change was the sharp increase from the mid 18th century, reaching 10 per cent by the early nineteenth century.”[13]
Britain’s economic growth was rapid by Western European standards even before the Industrial Revolution.[14] But the Industrial Revolution saw a qualitative acceleration. Taking ten-year periods to eliminate the effect of purely short-term fluctuations: by the 1780s, British annual GDP growth had reached 1.6 percent, and by the 1830s, 2.3 percent.[15] This secured the United Kingdom’s lead position in the world economy, already analyzed.
This rising trend in the share of gross fixed capital formation in the UK from the Industrial Revolution to 1950 is shown in Figure 3. The increase in the percentage of investment in GDP—a tripling or quadrupling, depending on the calculation made about the initial starting point—was of course enormous for this historical period, but only achieved a low level compared to later historical development.
In summary, from the 1760s to the 1830s, essentially covering the period of the Industrial Revolution, taking ten-year annual averages, Britain increased its percentage of investment in GDP from 3.3 percent to 10.5 percent and increased its annual average economic growth rate from 0.6 percent in 1700–60 to 2.3 percent. This established Britain as the leading economic state of the world.
The fact that Britain’s domestic investment did not progress beyond approximately 10 percent of GDP for a century from the 1830s then played a decisive role in Britain’s being overtaken by the United States as the world’s leading economy, as will be seen in the next section.
The United States overtakes the United Kingdom
The United States of course overtook Britain during the 19th century to become the leading international economy. The United States showed the next step upward in both the percentage of investment in GDP and the economic growth rate.
At the time of Britain’s Industrial Revolution, the United States was not among the world’s largest economies.[16] In 1775, Britain’s economy was almost 6 times larger than that of the United States.[17] Economic historians differ on the immediate development of the U.S. economy after independence, but by 1820, the most recent estimate is that the U.S. economy was still only 38 percent the size of the United Kingdom’s.[18] However, by 1840, the U.S. economy was already more than half the size of the United Kingdom’s, and by 1850, it was 73 percent, with a higher growth rate as well as a higher level of investment in GDP.[19] By the 1840s, therefore, the United States was already the most rapidly growing major economy; further U.S. economic acceleration after the Civil War was a continuation of this process. For that reason, the date of the United States’ becoming the major lead economy globally in terms of growth is taken here as dating from the 1840s—although it will be shown that taking a later date, for example, after the Civil War, makes no difference to the essential pattern. In terms of total GDP, the United States overtook Britain in the 1860s or 1870s, and by 1900, its total GDP was almost double that of the United Kingdom.[20]
Estimates for gross investment as a percentage of the U.S. economy are, unfortunately, not available for the period of the onset of Britain’s Industrial Revolution—they only become available in current prices from the period 1839–1848. By then, the U.S. level of investment already exceeded the UK: the share of gross national capital formation in U.S. GDP was 14 percent. During the course of the 19th century, the percentage of fixed investment in U.S. GDP rose sharply, eventually far surpassing that of Britain. U.S. gross capital formation oscillated between 14 percent and 16 percent of GNP until 1858, the eve of the Civil War. After the Civil War, this level then rose rapidly to far exceed the UK level. By 1869–78 the U.S. level was 19 percent of GDP; by 1879–1888, 21 percent; and by 1888-98, 23 percent (see Figure 4, which compares the United States and the United Kingdom).[21] This historically unprecedented U.S. investment boom, which had no equal in world history until that time, particularly following the Civil War, transformed the American economy.[22]
Figure 4
In summary, the United States surged to global leadership based on a level of investment in GDP that at that time had no precedent in world history. The advantage of the United States over other economies in fixed investment continued for a prolonged period. As Maddison notes: “The rate of U.S. domestic investment was nearly twice the UK level for the sixty-year period 1890–1950. Its level of capital stock per person employed was twice as high as that of the United Kingdom in 1890, and its overwhelming advantage in this respect over all other countries continued until the early 1980s.”[23]
As a result, from 1840 to 1950, the United States grew at an average annual rate of 3.9 percent—over 50 percent higher than the rate of British GDP after the latter had accelerated following the Industrial Revolution. [24]
The approximate level of fixed investment reached after the U.S. Civil War, slightly over 20 percent of GDP, with only a short-term catastrophic collapse during the Great Depression, was sustained, and still existed in the United States 140 years later, in the 2020s. The fact that, after far surpassing its British rival by the late 19th century, the United States did not increase its investment-to-GDP ratio for nearly a century and a half is crucial for explaining numerous trends in the modern world, as will be analyzed below.
For approximately a century, in particular from the end of the Civil War to the immediate aftermath of the Second World War, the U.S. level of investment of slightly over 20 percent of GDP was the highest of any major economy and the United States was the world’s most rapidly growing major economy. From 1850 to 1950, the average annual GDP growth rate of the United States was 3.8 percent, Germany and Japan 1.7 percent, and the United Kingdom 1.6 percent.
The cumulative effect of such growth rates sustained for almost a century was overwhelming in establishing U.S. dominance. From 1850 to 1950, the U.S. economy increased in size by 3,880 percent, Japan’s by 460 percent, Germany’s by 450 percent, and the United Kingdom’s by 370 percent (see Figure 5).
Figure 5
With total growth over eight times as great as any major competitor, laying the base for defeating both Germany and Japan in the world wars, the economic dominance of the United States in the period up to 1950 was crushing.
West Germany becomes the first major advanced economy to overtake the U.S. growth rate
Given this U.S. growth dominance for over a century, it was therefore a crucial historic development after the Second World War that, for the first time, a series of major economies began to see levels of investment of significantly over 20 percent of GDP, i.e., above the U.S. level, and achieved more rapid economic growth than the U.S.
The first of these economies was West Germany. By 1955 West Germany had achieved a level of gross fixed capital formation of 26.5 percent of GDP, above the U.S. level, and by 1964 this rose to 30.5 percent (see Figure 6). The United States then launched a major counteroffensive against Germany in the 1960s and 1970s, particularly with U.S. abandonment of the convertibility of the dollar to gold and the end of the Bretton Woods currency system in 1971.[25]
Figure 6
From 1950 to 1971, West Germany achieved an average annual GDP growth rate of 5.9 percent—the first time in history a major economy had grown faster than that of the United States over a sustained period. Despite the sharp fall in the percentage of investment in West German GDP after 1971 and a deep fall in its growth rate, West Germany/Germany still outgrew the United States with a 5.3 percent annual average growth rate during this period, due to West Germany’s very high level of fixed investment, in the forty-six-year period from 1946 to 1992.
The fast-growing East Asian capitalist economies
The second major economy after West Germany to achieve a higher level of fixed investment in GDP and a far higher growth rate than those of the United States was Japan. Japan achieved an even higher percentage of fixed investment in GDP, and a faster growth rate, than West Germany. By 1960 Japan’s gross fixed capital formation was 33.2 percent of GDP and by 1971 it was 37.5 percent (see Figure 7). As with West Germany, Japan was also struck by the U.S. counteroffensive in 1971 as U.S. abandonment of dollar-to-gold convertibility led to a sharp decline in Japan’s percentage of investment in GDP and a sharp economic deceleration. Japan, however, became the first economy to achieve a level of investment of over 35 percent of GDP and over a 46-year period, its annual average GDP growth rate was 6.4 percent.
Figure 7
From the late 1970s onward, Japan’s level of fixed investment was matched by the so-called Asian Tigers: South Korea, Singapore, Hong Kong, and Taiwan Province of China. As South Korea is the largest of this group, it will be analyzed in detail.
Starting from an extremely low level of fixed investment in GDP in the early 1950s, by 1979 South Korea’s level of gross fixed capital formation in GDP had reached 35 percent (see Figure 8). This similar pattern of Japan and the Asian Tigers formed what might be termed the “East Asian rapid capitalist growth model.” In 1997 South Korea was struck by another U.S. counteroffensive in the form of the East Asian debt crisis, in the same way that West Germany and Japan had been struck in 1971.This led to a fall in the percentage of fixed investment in South Korea’s economy and a sharp decline in its growth rate.[26] Nevertheless, South Korea’s annual average GDP growth, during its most rapid forty-six-year period of growth, was 8.4 percent.
Figure 8
Socialist China
From 1978, with Reform and Opening Up and the construction of a socialist market economy, China attained the fastest rate of growth of any major economy in history. China’s level of gross fixed capital formation in GDP reached over 40 percent of GDP (see Figure 9), and its annual average growth rate from 1978 to 2024 was 8.9 percent.
Figure 9
This extremely high level of fixed investment in GDP and very fast growth rate differentiate China’s economy from Western economies today. However, it is entirely clear from the preceding data that China’s level of investment and growth rate is neither an “aberration” nor a “miracle” but simply the latest and most advanced stage of a process of the rising share of investment in the economy—that is, of the rising organic composition of capital—that has been taking place for over 250 years since the Industrial Revolution.
Conclusions
As stated at the beginning, the aim of this article is to make clear the historical process of the rising proportion of investment in the economy. It does so by taking the entire period of economic development since the Industrial Revolution, without the need to use sophisticated statistical techniques to separate powerful long-term processes from purely short-term shifts. Doing so has made clear that China’s high level of investment in GDP is merely the latest stage in an historical process which has been taking place for more than two centuries.
Because this is such a deep-rooted economic process, one confirmed by short-term studies and entirely consistent with the predictions of economic theory, it is clear that this historical trend will not stop with China’s current development. In the future, economies will develop that will invest more than 40 percent of GDP. The only issue is whether China will continue to lead this historical process or if another economy will do so. That, in turn, will be determined by China’s own policy choices.
Numerous consequences follow from this historically rising proportion of investment in the economy. For reasons of space, only a few of the most important can be summarized here; others will be dealt with, or have already been dealt with, in separate articles.
- Clearly, there is no ambiguity as to the trend of the rising proportion of investment in the economy with historical development. This trend was predicted by Adam Smith, particularly analyzed by Marx (as the rising organic composition of capital), and again predicted by Keynes. While this article, for reasons already stated, has examined an extremely long historical period, this factual conclusion of the rising proportion of fixed investment in the economy is confirmed even by those opposed to both Marx and Keynes and who consider different timeframes.
For example, Barro (who, together with Lucas and Sargent, is one of the founders of New Classical Macroeconomics and of the theory of rational expectations) surveyed trends since 1870. He arrives at exactly the same conclusions: “For the United States, the striking observation…is the stability over time of the ratios for domestic investment and national saving…. The United States is, however, an outlier with respect to the stability of its investment and saving ratios; the data for the other…countries show a clear increase in these ratios over time. In particular, the ratios for 1950–89 are, in all cases, substantially greater than those from before World War II. The long-term data therefore suggest that the ratios to GDP of gross domestic investment and gross national saving tend to rise as an economy develops.”[27]
In short, despite Barro’s overt opposition to Keynes and his attempt to totally ignore Marx, he is forced to arrive at the same economic conclusions as outlined above.
- This more than 250-year historical pattern confirms the clear positive correlation between the percentage of investment in GDP and the rate of economic growth—that is, an increasing proportion of investment in the economy is accompanied by rising economic growth rates. The historical trend shown above is consistent with the strong positive correlation in large economies between the percentage of fixed investment in GDP and the economic growth rate during the most recent periods.[28]
- The fact that systematic measures of net fixed capital formation, as opposed to only gross fixed capital formation, are available for more recent economic periods simply means that modern studies establish this extremely strong positive correlation between the percentage of fixed investment in GDP and the economic growth rate still more clearly than the long-term historical studies used here. For large economies, the recent correlation between the percentage of net fixed capital formation in GDP and the economic growth rate is over 0.9, i.e., as close to a perfect correlation as will be found in any real economic process.[29]
- This strong positive historic correlation between the percentage of fixed investment and economic growth is entirely that which would be predicted by economic theory. This is because capital is an input into the production function in both Western and Marxist economic theory.[30] Therefore, increasing the proportion of the economy used for investment, by increasing inputs of fixed capital, would be predicted to increase the economic growth rate—precisely as confirmed by both historical and short-term studies.
- The obverse of this positive correlation between the percentage of fixed investment in GDP and the economic growth rate is that the lower the percentage of fixed investment in GDP, the slower will be the economic growth rate. This is entirely confirmed by the facts.[31]
- The consequences of raising the level of consumption in GDP are therefore clear. As investment plus consumption constitutes 100 percent of the domestic economy, increasing the percentage of consumption in GDP, because it necessarily means reducing the proportion of investment, will slow economic growth. Arguments in favor of increasing the proportion of consumption in China’s GDP are therefore, in fact, arguments in favor of slowing China’s rate of economic growth.
- Furthermore, because there is an extremely strong positive correlation between the rate of growth of GDP and the rate of growth of consumption, an argument for increasing the percentage of consumption in GDP, by reducing the economic growth rate is, in fact, an argument in favor of slowing the rate of growth of consumption/living standards. This is why there exists a factual negative correlation between the percentage of consumption in GDP and the growth rate of consumption—that is, the higher the percentage of consumption in GDP, the lower will be the growth rate of consumption.[32]
- This fact—that increasing the percentage of consumption in GDP leads to slower GDP growth—is in line with economic theory. Consumption, by definition, is not an input into production. Therefore, raising the percentage of consumption in GDP, which necessarily lowers the percentage of investment in GDP, means replacing something which is an input into production (investment) with something which is not an input into production (consumption). Lowering inputs into production necessarily lowers the economic growth rate. As the growth rate of consumption is strongly positively correlated with the GDP growth rate, lowering the rate of economic growth necessarily lowers the consumption growth rate.
- From the viewpoint of verifying or falsifying economic theories, the historical data clearly and entirely confirms Smith’s, Marx’s, and Keynes’s conclusion that the percentage of fixed investment in GDP rises with economic development. Referring to investment as part of constant capital, Marx noted that “this law of the progressive increase in constant capital, in proportion to the variable, is confirmed at every step.”[33] Marx’s analysis, developed in the 1860s at a time when, compared to the present day, the level of fixed investment was very low, and which therefore predicted almost over 150 years of economic development, is clearly a work of historical genius. It is also a strong confirmation of Xi Jinping’s analysis that “our study of political economy must be based on Marxist political economy and not any other economic theory.”[34]
- These economic facts clearly affect the type of stimulus programs which are required in China. The trends outlined above are fundamental and strategic—i.e., medium to long-term ones. They do not contradict the fact that, to deal with shorter-term economic fluctuations, consumer stimulus may be required. But strategically the rate of China’s economic growth depends on its high level of investment. Short-term stimulus must fit with this economic strategy.[35]
- Increasing capital intensity of production is a key foundation of Justin Yifu Lin’s New Structural Economics (NSE). It is clear from the historical data given above, from shorter-term studies considered elsewhere, and from the factual studies carried out even by anti-Marxist and anti-Keynes economists, that this foundation stone of NSE is correct. That is, the historical development of production, and the advance to more developed stages of economic production, is one of increasing capital intensity of production. This confirms that NSE is entirely consistent in this respect with the economic facts and the conclusions on this reached by Smith, Marx and Keynes. Any theory which, unlike NSE, does not arrive at a conclusion of the rising capital intensity of production with economic development is not in line with the facts.
Finally, why are obviously correct things rejected?
But all these facts raise an obvious question. That investment rises as a proportion of the economy with economic development is unequivocally confirmed by historical data, by short-term studies (even by anti-Marxist and anti-Keynes analysts), and by economic theory. Why, therefore, are attempts made to deny this entirely clear fact? And why are attempts made to deny their practical consequences for China?
The first is conscious and unconscious Western arrogance. Factual comparison of economies immediately reveals that the structure of China’s economy, in terms of the level of investment, is different to that of a Western economy. But China’s annual average economic growth is around 5 percent and that of the United States is slightly above 2 percent. Any objective judgement, therefore, would logically conclude that China’s structure was superior to the West’s in producing economic growth.
But seeing that China’s economic structure differs from the West’s, Western commentators are immediately led to the entirely illogical conclusion that it must be China’s economic structure, not the West’s, which is the problem! Instead, the fact that China’s level of investment is much higher than that of Western economies should logically lead to the conclusion: Yes, of course, China is different. Of course China does not correspond to the average. Because China’s is a much more rapidly growing economy than the West. If China had the same economic structure as the West, then it would slow down to the same low speed as the West! The problem is therefore not China’s high level of investment, with its fast growth rate. China is just the latest stage in a process which has been going on for 250 years, since the Industrial Revolution, of a rising proportion of the economy which is used for investment.
China’s economy generates more rapid economic growth and more rapid growth of consumption. The problem is with the Western economies, which have fallen behind the historical trend of the rising percentage of investment in GDP and are therefore trapped in slower growth.
But Western arrogance means it is impossible for them to understand or admit that it is China’s investment level which is superior, and the continuation of a fundamental trend of economic development, and it is the Western economies which are falling behind.
An example: The illogicality of Goldman Sachs
To take a precise example: Goldman Sachs projects that China’s GDP growth will fall sharply to an average 3.4 percent in 2023–32. The reason for this alleged slowdown is because the annual increase in GDP growth created by capital investment is projected to fall by 2.4 percent. And, in turn, the reason for this predicted sharp slowdown is that, Goldman Sachs argues, China’s level of investment in its economy will fall sharply: “Investment as a share of GDP is forecast to decline from 42 percent in 2022 to 35 percent by 2032.”
The reason this will happen is allegedly because China’s level of investment is higher than other economies at a similar level of development. China is at present an upper middle-income economy, although approaching the level of a high-income economy, by World Bank standards, and “investment as a share of GDP in upper-middle-income countries is 34 percent.” Thus, it is argued that China should reduce its level of investment and slow down to the growth rate of other economies.
Why on earth should China do this? China is producing a more rapid increase in average living standards than these Western economies, it is creating more rapid economic growth, it has produced a more rapid reduction in poverty than they have, and so on. The economy with the most rapid economic development is, of course, different from countries with slower economic development. But China is different precisely because it is in line with a trend in economic development, which has been occurring for over two centuries,
A comparison will make the ridiculousness of the argument, and the unconscious Western arrogance, clear. Suppose a company wanted to enter a new industry and asked Goldman Sachs for advice, and Goldman Sachs reported: “In this industry one company is clearly growing much more rapidly than the others. Therefore, you should not learn from this more rapidly growing company, you should copy the more slowly growing companies.” Everyone would laugh at such a proposal—just before they cancelled the contract with Goldman Sachs. But in terms of country-level comparisons, that is exactly what is being proposed.
The only reason the absurdity of these arguments is not immediately clear is the conscious and unconscious arrogance of Western analysts, which makes them think that if there is a difference between China and the West, it must be the West which is correct, even if the objective evidence is to the contrary. That this is Western arrogance is transparently obvious, because the purely economic arguments are so fallacious and contrary to the facts of historical development.
Conclusion
China’s high level of investment is not an aberration. It is the latest stage of an economic process which has been taking place for 250 years since the Industrial Revolution. It is a sign of the historically advanced character of China’s economy, and its development, in a specific national situation, is in line with historical trends.
10
11
ICBC rolls out cross-border RMB solutions as world shifts toward currency diversification
(www.chinadaily.com.cn)
13
14
Megawatt hydrogen turboprop engine completes maiden flight in central China
(www.chinadailyhk.com)
14
25
16
10
[

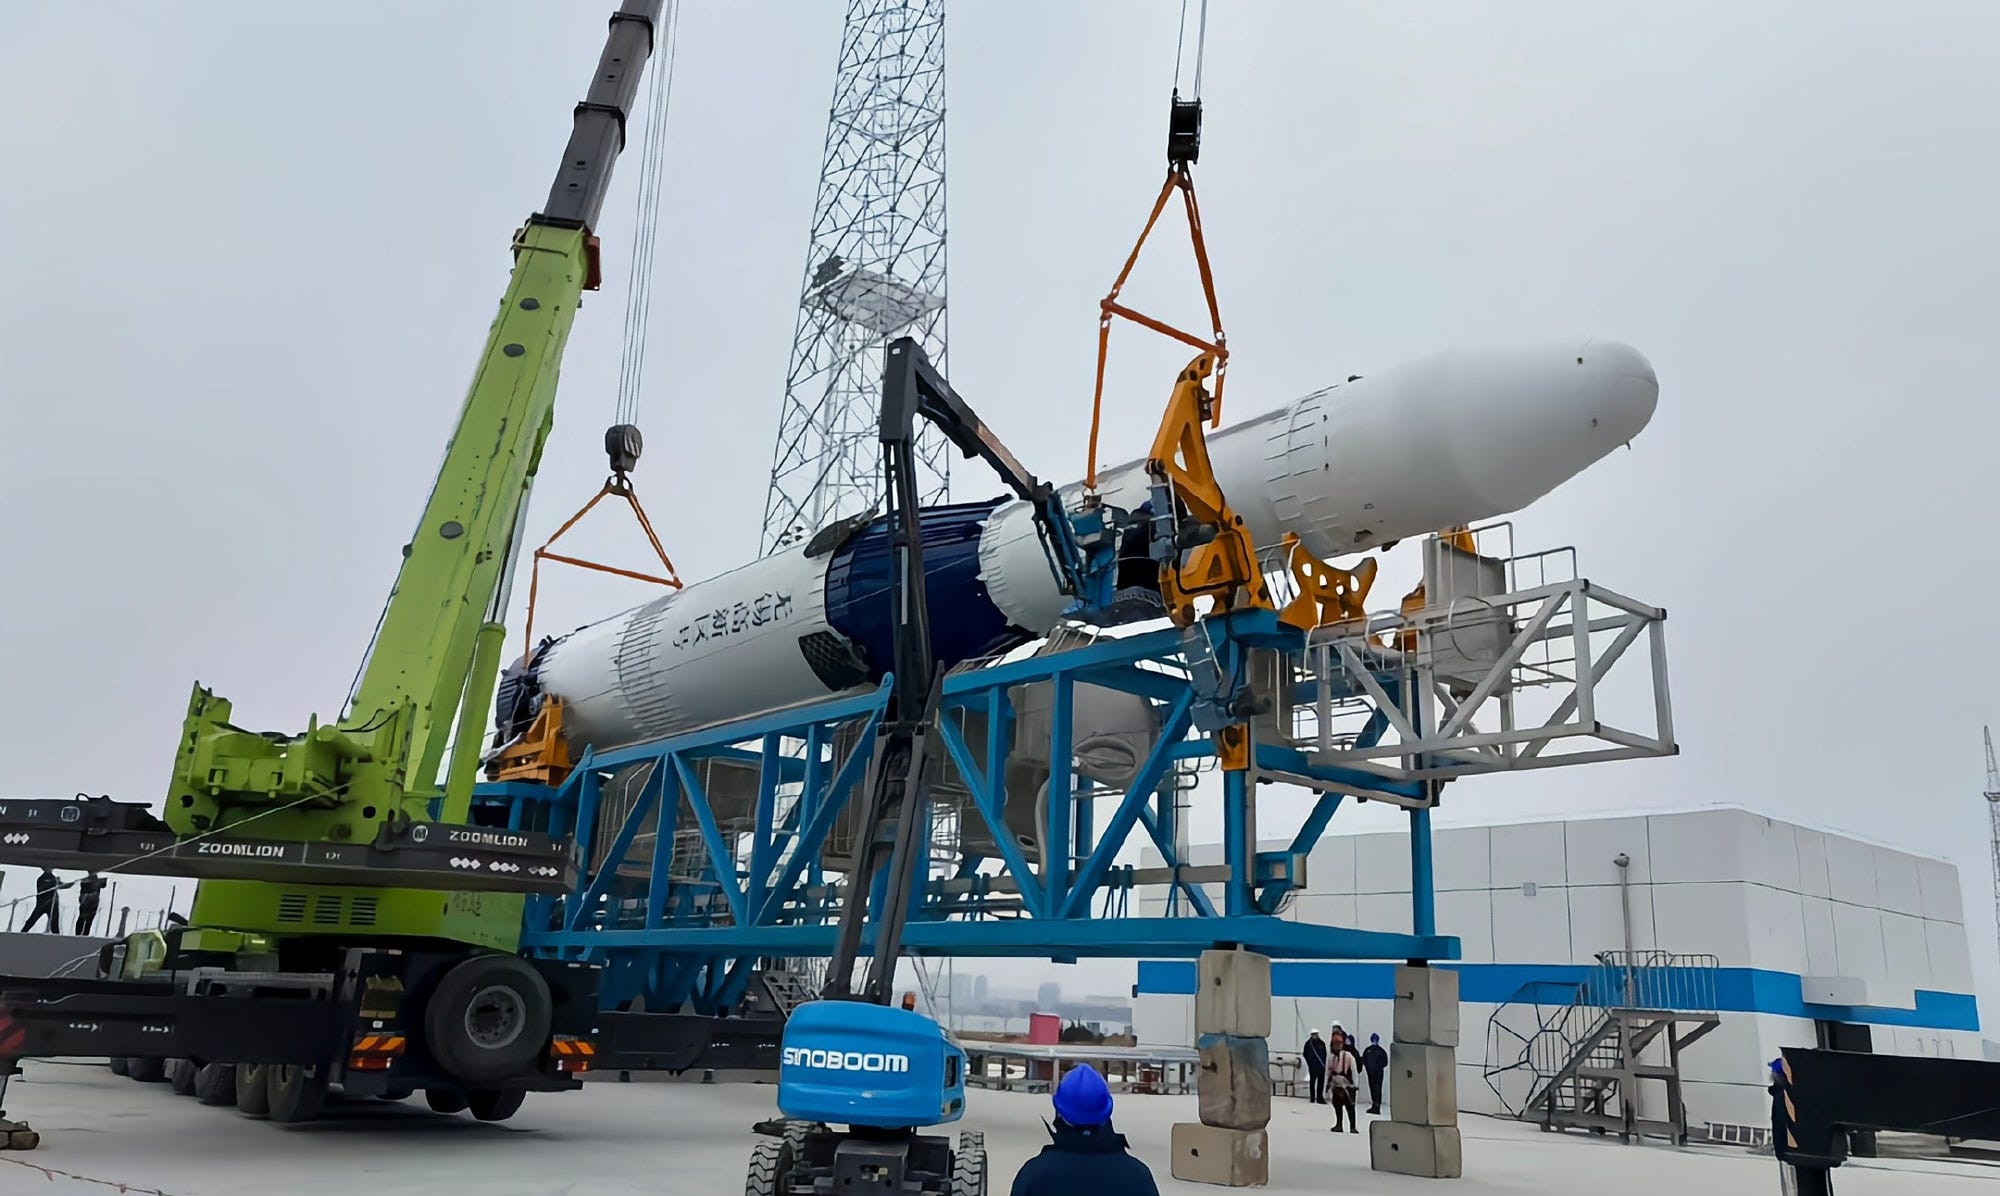
Deep Blue Aerospace’s Nebula-1A launch vehicle being placed onto a transporter-erector at Haiyang’s new liquid propellant launch pad in the second half of March 2026.
Having conducted static fires of Nebula-1A’s1 second and first stages in September and November 2025, Deep Blue Aerospace may be nearing its first orbital flight with a complete vehicle spotted in Haiyang (海阳市), Shandong (山东) province. Nebula-1A was first spotted in the coastal city, which usually supports vehicle testing, back in mid-March.
While the launch vehicle has been in Haiyang, Deep Blue’s communications team has been tight-lipped, with supporting enterprises also being vague. Once such enterprise was the Beijing Academy of Space Launch Technology (北京航天发射技术研究所)2, who specialize in vehicle and site testing, having recently completed liquid rocket propellant hardware tests on one of the city’s artificial islands. In a recent blog post, the enterprise shared that they have commissioned the recently built ‘Lianli Island Sea Flight Recovery Test Platform No.-1 (连理岛海上飞行回收试验1号平台)’3 with a vehicle on that pad, writing:
“From March 30 to March 31, 2026, the platform successfully supported the integrated test mission for a certain type of rocket. This marks the platform’s full operational capability to support rocket launches … During the rocket joint training, it successfully carried out the full-process drill for the refueling and venting of liquid oxygen, liquid nitrogen, and kerosene, and stably provided high-pressure gas sources.”
If there are any problems with this translation please reach out and correct me.
While not saying what the launch vehicle was used, only one has been spotted on the artificial island, being Nebula-1A. Nebula-1A is also a very suitable choice for the test due to its small size and propellant usage compared to other liquid-fuelled rockets in China.
As for what Nebula-1A is doing in Haiyang (more on the spaceport later), Deep Blue has not provided a reason. In a China Central Television (中国中央电视台) report from the end of 2025, it was said that the launch vehicle will perform its debut launch from Haiyang and fly into orbit while attempting a first-stage splashdown. People’s Daily (人民日报) repeated that in mid-March, with Nebula-1A appearing around the same time with four grid fins but no landing legs4. Alternatively, rumours circulating say that the second-stage will not reach orbital speeds but will still ignite.
For that flight, Nebula-1A will stand 30.2 meters tall with a reusable first-stage diameter of 3.35 meters as well as a second-stage and fairing diameter of 2.25 meters. The first-stage is equipped with nine Thunder-R engines that generate 22 tons of thrust each, for a total of 198 tons, while the second-stage has a single vacuum-optimized version. If heading into orbit, Deep Blue says that the launch vehicle can carry up to 2,000 kilograms into low Earth orbit.
[

Deep Blue Aerospace’s Nebula-1A launch vehicle being taken to Haiyang’s new liquid propellant launch pad.
Ahead of the upcoming flight, Deep Blue has conducted two hop tests with Nebula-1A first-stages, equipped with three engines instead of nine. The first took place in September 2024, flying almost completely successfully before software errors left the vehicle hovering several meters above the ground. Then, between July 28th and August 2nd 2025, a second hop was attempted and never spoken of directly due to loss of control and explosive crash.
After a handful of flights in the launch vehicle’s current design, Deep Blue plans to upgrade to Nebula-1B, which will stretch the reusable first-stage, equip it with eleven Thunder-R engines, and widen the second-stage to 3.35 meters, allowing the rocket to carry at least an extra 1,000 kilograms.
Since June 2019, the Haiyang Oriental Spaceport (海阳东方航天港) has been supporting the assembly of and performing sea-based launches for over two dozen solid propellant launch vehicles via dedicated floating platforms or vessels5, with the most powerful being OrienSpace’s Gravity-1, able to lift up to 6,500 kilograms. In recent years, the spaceport has also opened up to suborbital experimental reusable rocket tests and test firings of liquid propellant boosters.
In opening to liquid propellant vehicles, the Haiyang Oriental Spaceport realized that conventional launch vehicles, currently utilizing in-land launch sites and those in Hainan (海南) province, can be flown safely too. As part of plans to expand spaceport operations with a 500 million Yuan (72.59 million United States Dollars, as of April 4th) investment in May 2025, the ‘Lianli Island Sea Flight Recovery Test Platform No.-1’6 was established and took over an island formerly part of a failed real estate project. Work on the launch pad appears to have begun in June 2025, with liquid oxygen, liquid methane, and rocket-grade kerosene propellant systems installed by November 2025.
And now, as of the end of March, the new liquid propellant launch pad is basically completed with its first launch vehicle standing atop of it. With the ability to handle liquid methane and rocket-grade kerosene, ‘Lianli Island Sea Flight Recovery Test Platform No.-1’ is likely a multi-user launch pad, similar to Commercial Launch Pad 2 at the Wenchang Commercial Space Launch Site and the Long March 12 Series Launch Pad at the Jiuquan Satellite Launch Center. It’s unknown what other launch vehicles may fly from Haiyang given the opportunity.
[
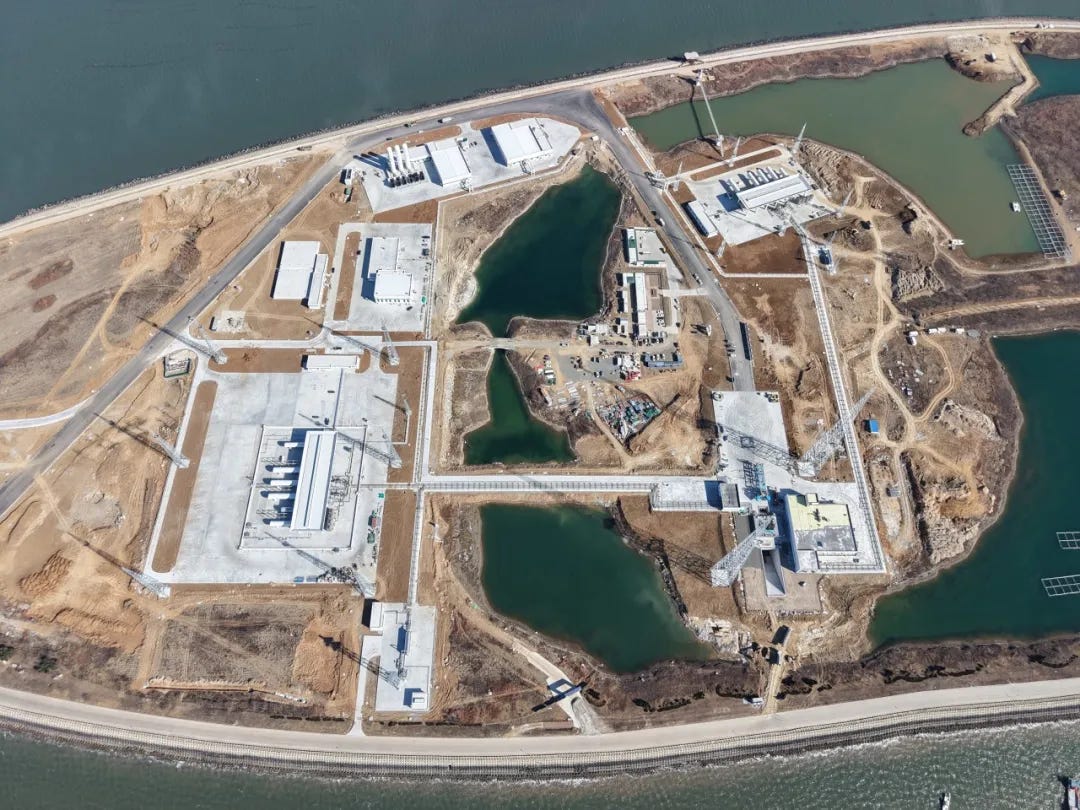
 as seen from above with its commodity systems surrounding it.")
Lianli Island Sea Flight Recovery Test Platform No.-1 (bottom right with the flame trench) as seen from above with its commodity systems surrounding it.
Thanks for reading China in Space! This post is public so feel free to share it.
What Deep Blue Aerospace is calling the variant of the Nebula-1 launch vehicle that will perform the vehicle’s first handful of flights. It features a smaller diameter and a shorter second-stage.
Under the China Aerospace Science and Technology Corporation.
Possibly also known as Lianli Island Workstation No.-1 (连理岛一号工位).
Landing legs are not needed for a splashdown, as there’s nothing to land on.
For why China is performing sea-based launches, see the insightful video embedded below from Dongfang Hour:
At its closest point between the artificial island and the mainland, the distance is 1,300 meters. From the launch pad to an inhabited structure, it is 2,400 meters.
17
50

According to a CNN report, China is expanding infrastructure in Sichuan Province. The report cites documents detailing the eviction of villagers and the seizure of their land, as well as satellite images from Vantor (formerly Maxar Technologies) and Airbus, showing changes in the landscape over the past five years. Large-scale construction is underway on the sites of old villages, with buildings associated with the nuclear weapons complex appearing. Research institutes located near Zitong County are also expanding.
Facility 906 near the Tongjiang River stands out, with a new reinforced dome constructed. According to experts interviewed, the combination of changes (the addition of radiation monitoring systems, ventilation, enhanced security, and a tunnel) may indicate work with highly radioactive materials.
The publication is necessary to confirm recent US claims regarding China's nuclear tests in 2020 and the expansion of its nuclear arsenal. Apart from the statements of experts working for US government-funded NGOs, there is no evidence linking the buildings to China's nuclear program.
CNN previously reported on Donald Trump's planned trip to China in May, where he intends to begin discussions on a possible agreement to limit China's nuclear program.
18
16
21
32
23
12
24
49
CPC Central Committee, Xi invite KMT chairperson to visit mainland - Global Times
(www.globaltimes.cn)
25
70
view more: next ›
China
2659 readers
70 users here now
Discuss anything related to China.
Community Rules:
0: Taiwan, Xizang (Tibet), Xinjiang, and Hong Kong are all part of China.
1: Don't go off topic.
2: Be Comradely.
3: Don't spread misinformation or bigotry.
讨论中国的地方。
社区规则:
零、台湾、西藏、新疆、和香港都是中国的一部分。
一、不要跑题。
二、友善对待同志。
三、不要传播谣言或偏执思想。
founded 5 years ago
MODERATORS