this post was submitted on 24 Aug 2023
173 points (94.4% liked)
World News
32315 readers
961 users here now
News from around the world!
Rules:
-
Please only post links to actual news sources, no tabloid sites, etc
-
No NSFW content
-
No hate speech, bigotry, propaganda, etc
founded 5 years ago
MODERATORS
you are viewing a single comment's thread
view the rest of the comments
view the rest of the comments
anyone know a better radioactivity monitoring site than this one?
https://map.safecast.org/?y=37.527&x=140.969&z=10&l=0&m=2
Fukushima sure is lit up like a Christmas tree on this one.
"Lit up like a Christmas tree" - yeah, at 4 µSv per hour. So you'd have to swim there for just about 4000 hours to get the equivalent of a full body CT scan.
I guess camping at Chernobyl is no big deal now as well.
https://map.safecast.org/?y=51.384&x=30.078&z=12&l=0&m=2
Yes, that's literally true (or was before the Russian army visited). The ambient radiation in the Chernobyl Exclusion Zone, which is all you'd see on a map, is only slightly elevated. The main risk there is of disturbing the ground or abandoned debris and exposing much more dangerous material buried just below the surface.
RIP the trench digging soldiers
Sounds like eating stuff that lives there would be unadvised as well.
There were tourist trips into the exclusion zone around Pripyat (closest town to the plant) all the time until Covid. I'm guessing they haven't restarted because of the war now, but plenty of people visited with no ill effects.
Visiting, sure. Eating products grown/harvested there seems ill advised.
Because the color gradient is relative. A large enough banana would also light up. Also exposure time is another factor and this will dissipate very quickly. You can play it safe by abstain of seafood and swimming for a week.
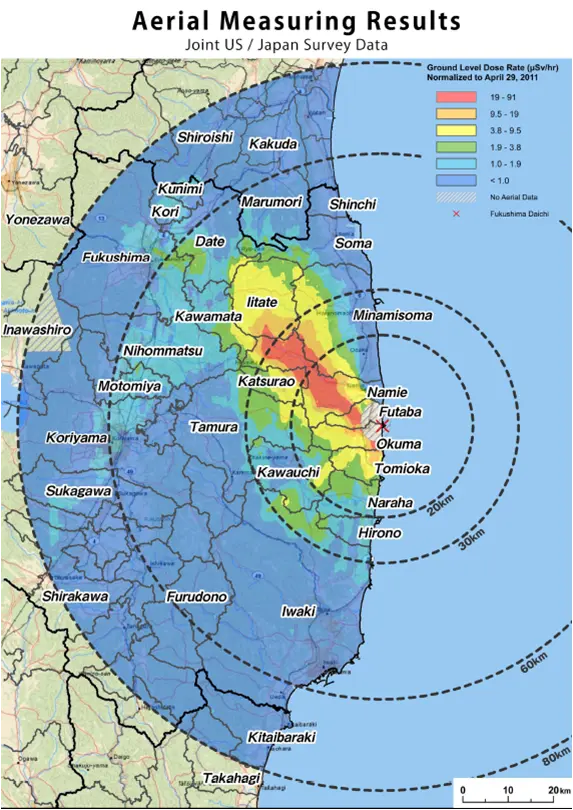
Radiation levels have decreased since the accident in 2011:

https://upload.wikimedia.org/wikipedia/commons/0/06/Fukushima_radiation_dose_map_2011-04-29.png
Note that on Safecast, you can enable "Crosshair" in the hamburger menu to see the actual numbers.
The central blob area is currently around 5 μSv/hr, so if you live there for a year it's 44000 μSv, or 44 mSv. The xkcd chart says 100 mSv is the lowest one-year dose clearly linked to increased cancer risk.
So 3 years there equals measurable increased cancer risk.
Cancer risk from radiation is not just the absolute amount of exposure, but the duration of the exposure as well. Short high-intensity radiation doses carry higher risk than long, low-intensity doses.
And 100mSv/yr is a rate, which is greater than 44mSv/yr. After 4 years, you will still have not had the dose needed that is linked with increased cancer risk.
Read it again. Not what they said.
44 x 3 = 132 which is GREATER than 100
You can’t compare exposure over 3 years to a limit for one year.
Radiation damage depends on time period of exposure.
Though I still wouldn't want to live there; the area has been evacuated for good reason.
the graph on the map is μSv/h
using the crosshairs shows 29.88 μSv/h at the waterfront by the plant
that is 0.02988 μSv/h = 261.7488 mSv/a
so not a place I'd want to get food from to say the least
That's on land. Where a whole bunch of various radionuclides have concentrated and remain fixed in place.
This "wastewater release" that's being discussed is the release of low-intensity tritium that will immediately dilute into the whole ocean. You're comparing apples to moonrocks. Completely different things.
Sure, just pick a completely different location to suit the conclusion you already made.
You mean the location right next to where the water has been sitting for how many years now?
So the yellow spots are 10 microsieverts per hour, the equivalent of a dental radiograph. A week of constant exposure will bring you up to flight attendant levels. More context can be viewed on this Wiki article.
One week equals one year as a flight attendant.
Hmm.
Well obviously