19
China Crosses Energy Milestone as Coal Falls Below 50% of Power
(www.bloomberg.com)
The article title buries the lede.
Even so, coal use is still rising in absolute terms. Output from thermal power plants increased in the first half as electricity demand grew, partly driven by high-tech manufacturing, electric-vehicle charging and data centers. Coal’s share fell as cleaner sources expanded even faster.
China is still using more coal, creating more gaseous carbon, and building new coal-fired power plants than ever before.
They've always had trouble transferring power from their mega solar projects in Tibet to their coastal population centers. Upgrading their grid was never a priority, and a large percentage of their solar output went to waste.
The implication from these numbers is that they've built AI datacenters near the solar megaprojects that are putting that unused solar energy to use, in addition to increasing China's fossil energy use. This is a classic case of Jevons-y solar energy production creating more environmental devastation while being falsely touted as a green victory.
China is still by far the world's largest coal producer and consumer, and the country's economy is still heavily reliant on coal and other fossil fuels. It will have to be seen whether this 'milestone' is sustainable or an effect of China's slowing economy.
Meanwhile, the share of coal in electricity generation in the EU fell from 16% in 2022 to 12% in 2023, and it's still going down.
this is not exactly uplifting news :(
Discussion of climate, how it is changing, activism around that, the politics, and the energy systems change we need in order to stabilize things.
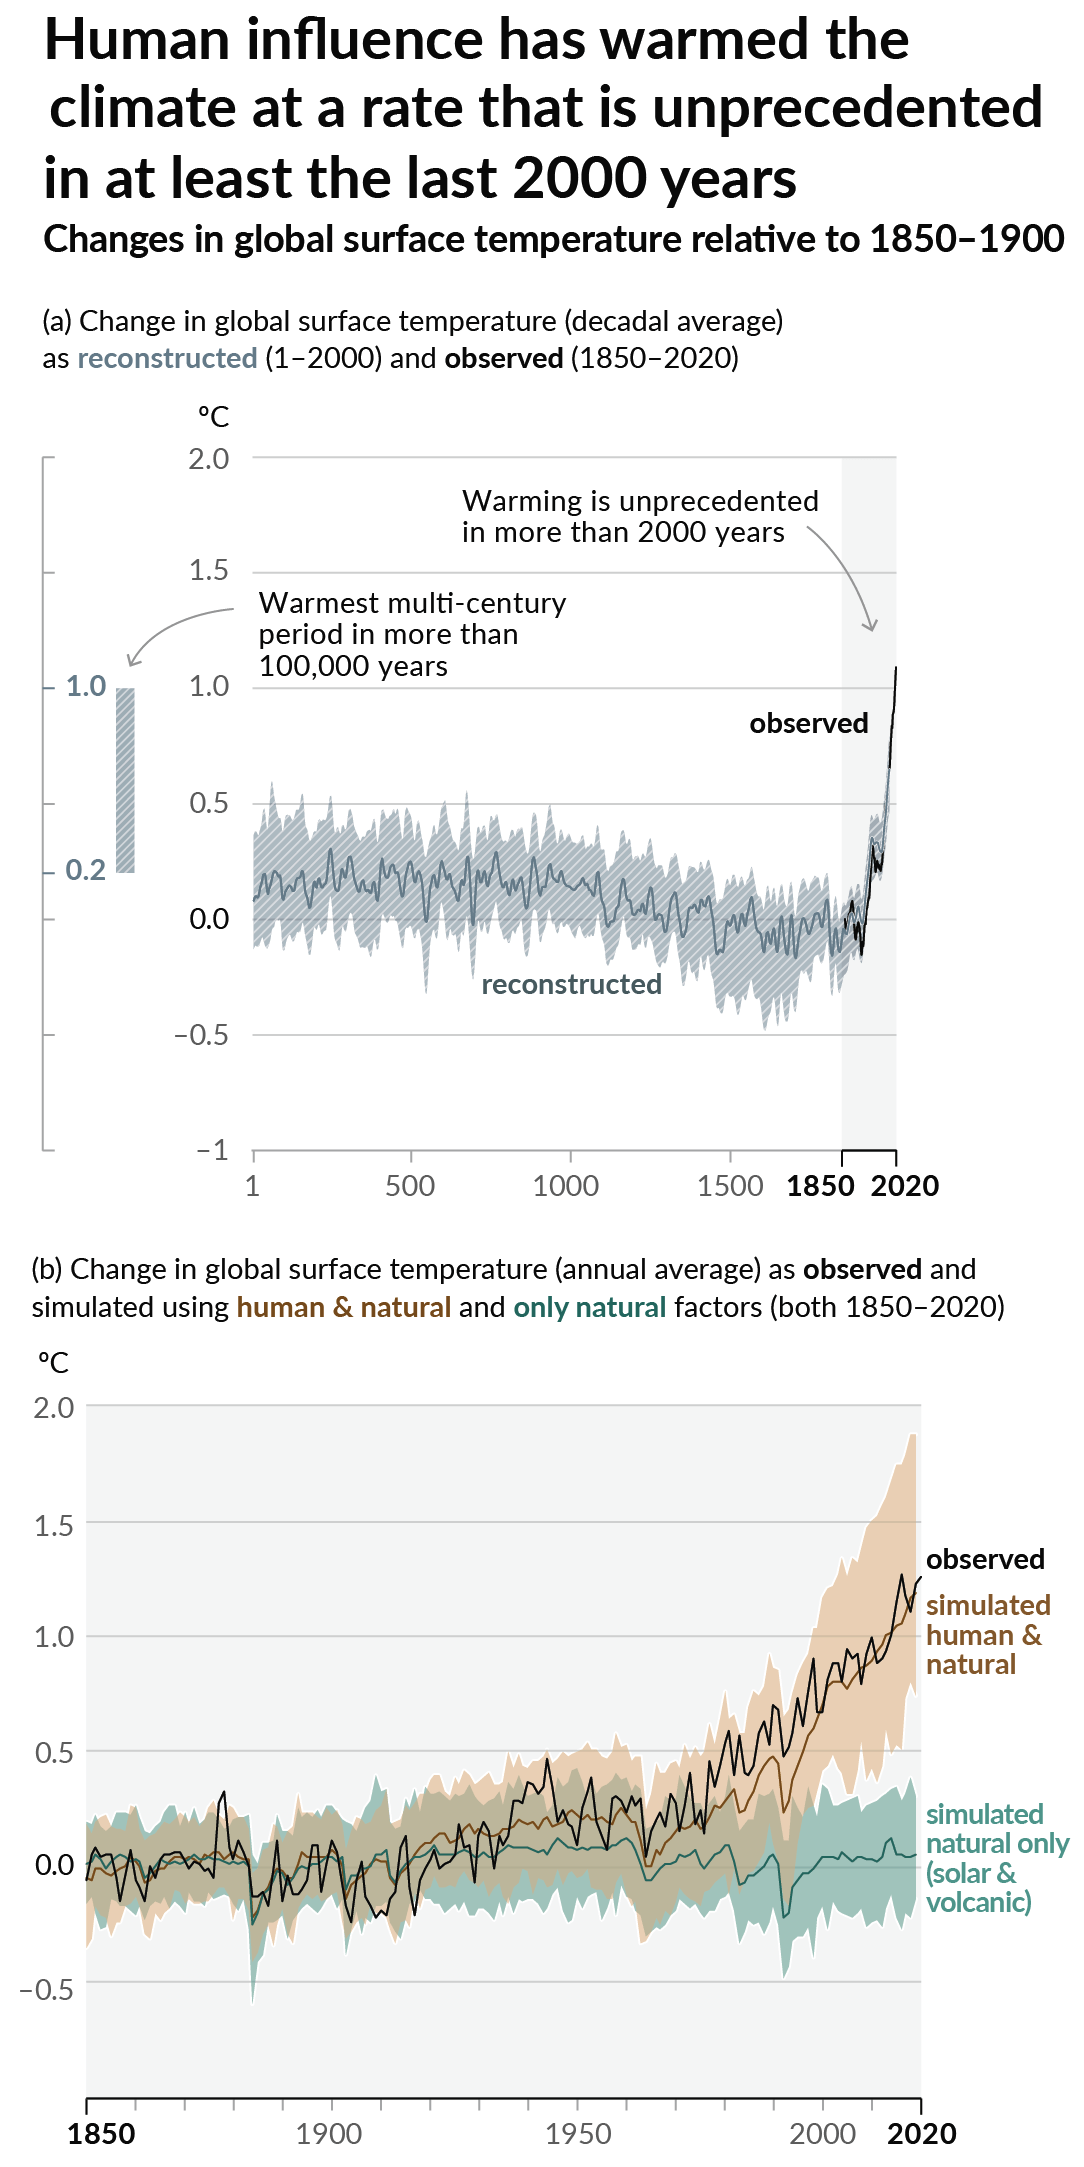
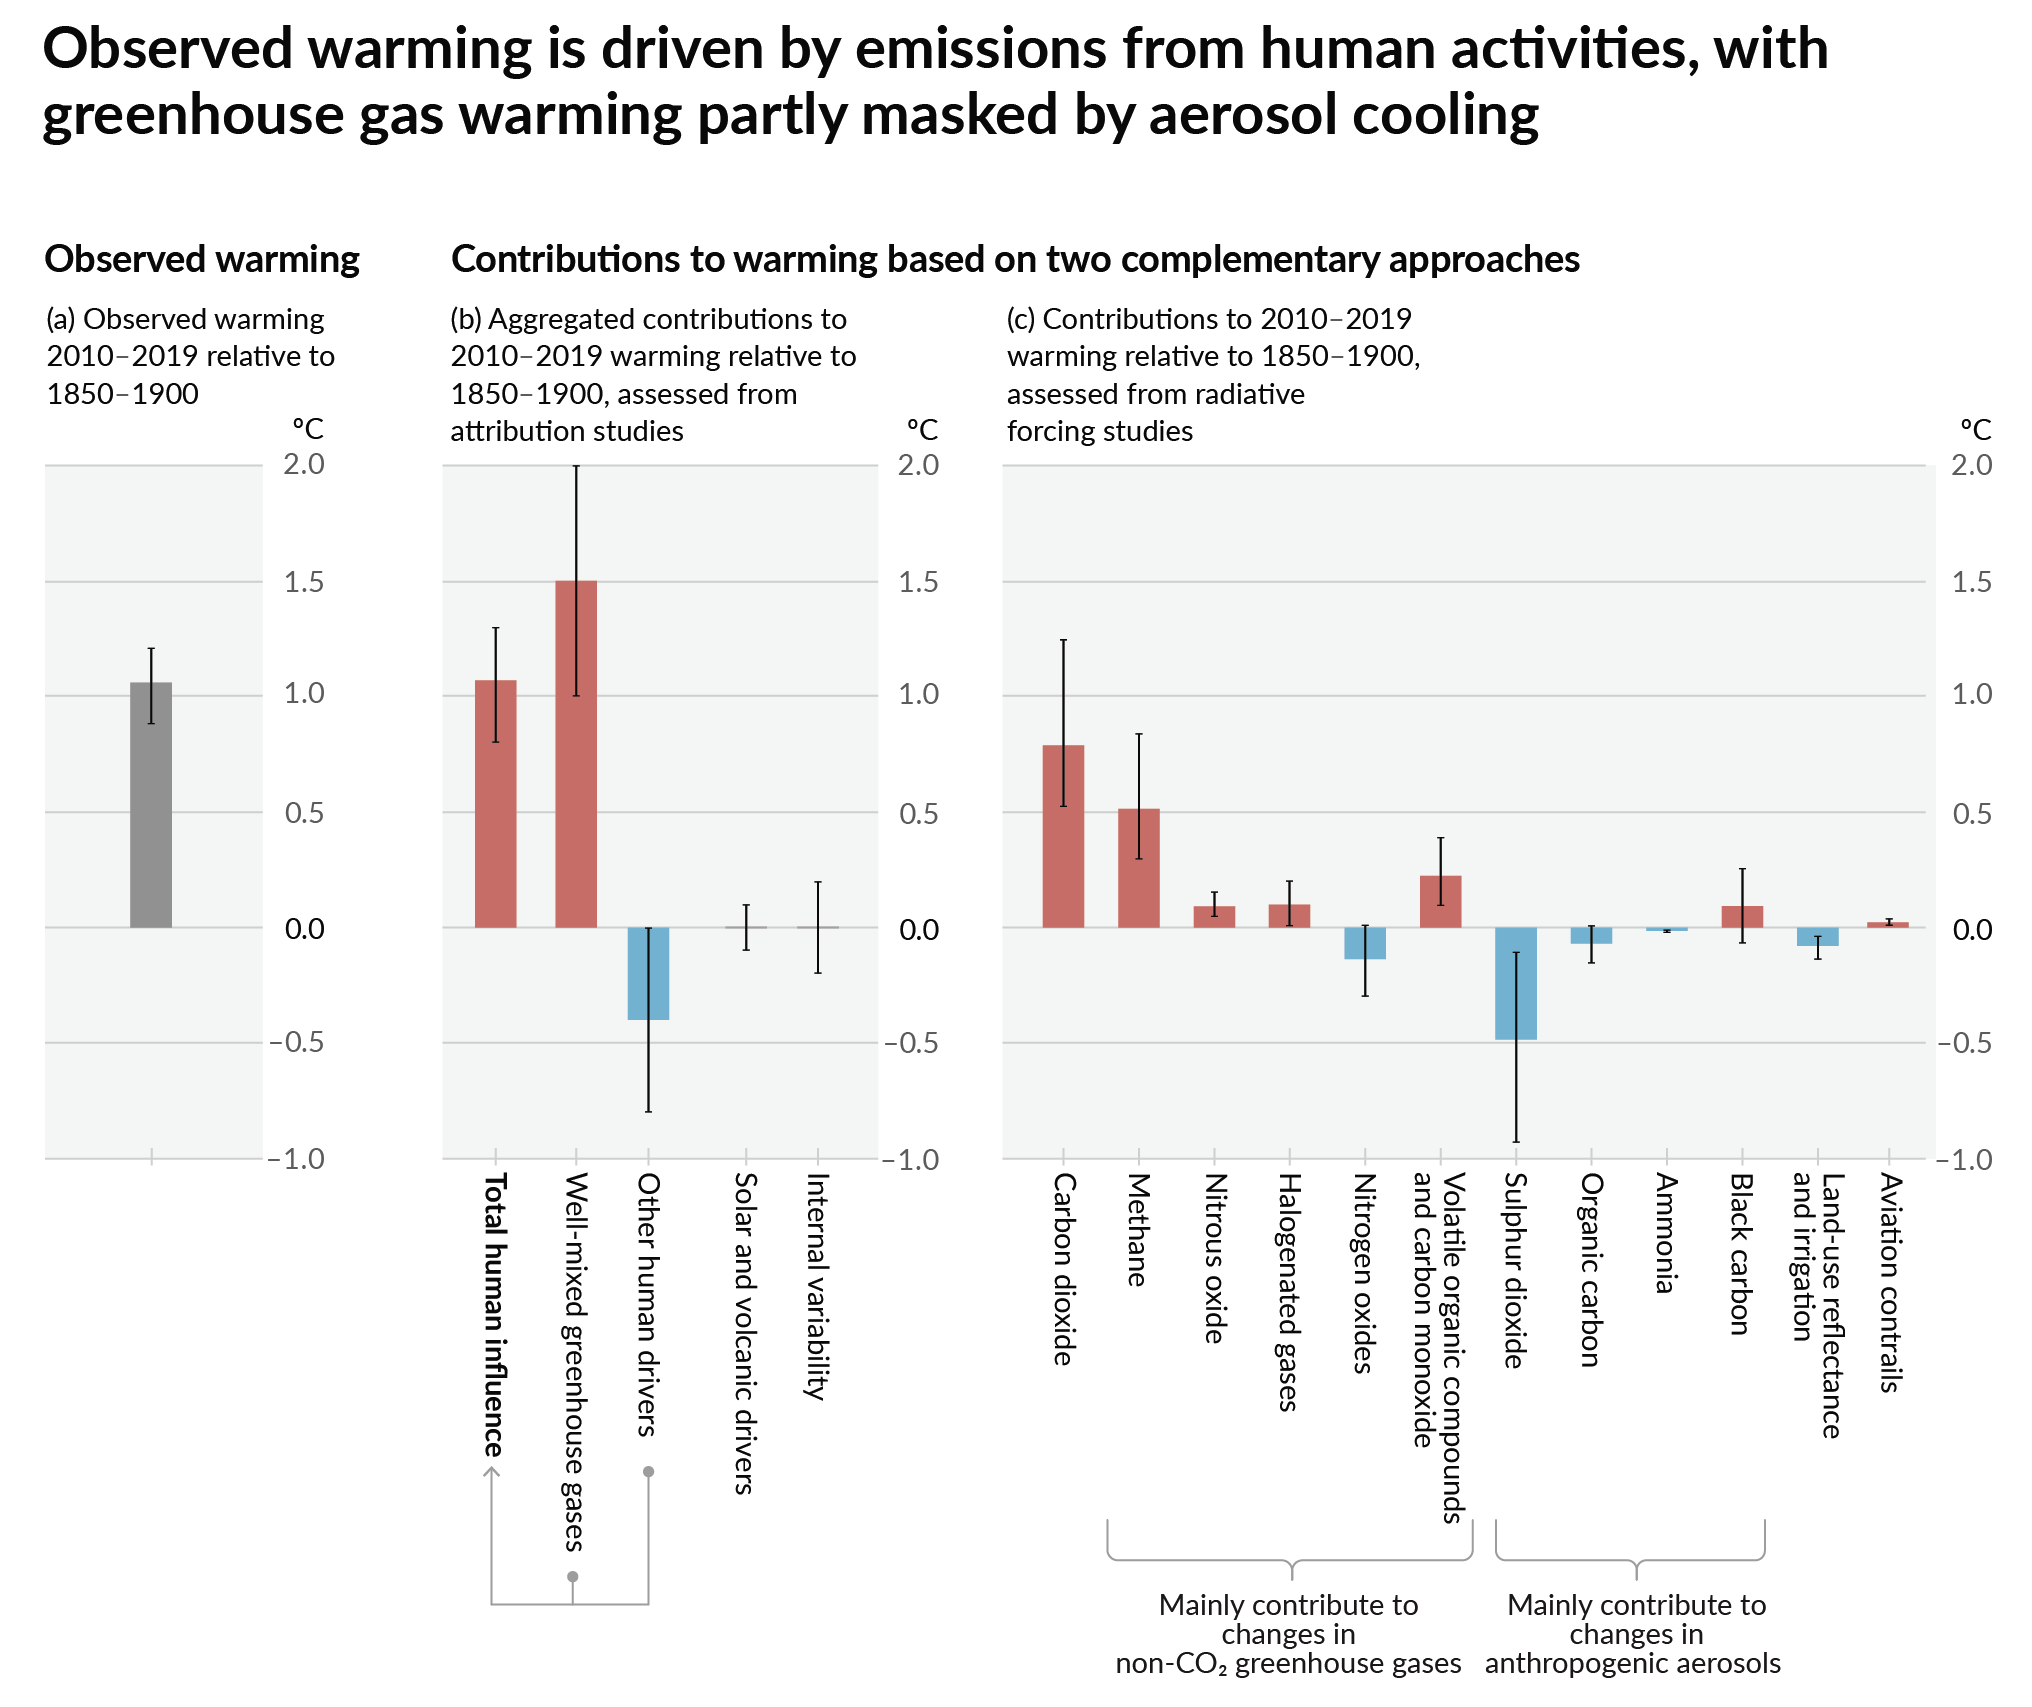
As a starting point, the burning of fossil fuels, and to a lesser extent deforestation and release of methane are responsible for the warming in recent decades:
How much each change to the atmosphere has warmed the world:
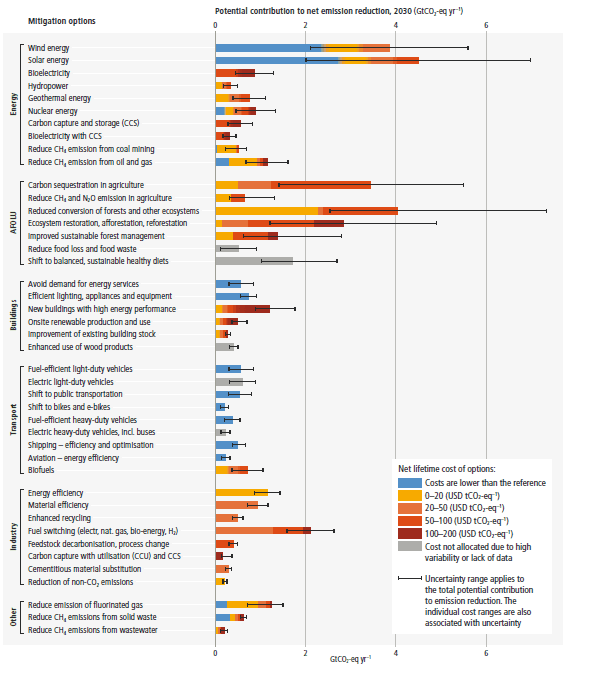
Recommended actions to cut greenhouse gas emissions in the near future:
Anti-science, inactivism, and unsupported conspiracy theories are not ok here.