Nothing surprising there. The main thing I've noticed between younger and older couples, is that younger couples don't tend to normalize disliking your partner
Oh… by that you mean boomer humor, I think.
Take my wife… please!
I think so? I just call it "stupid stuff old people do"
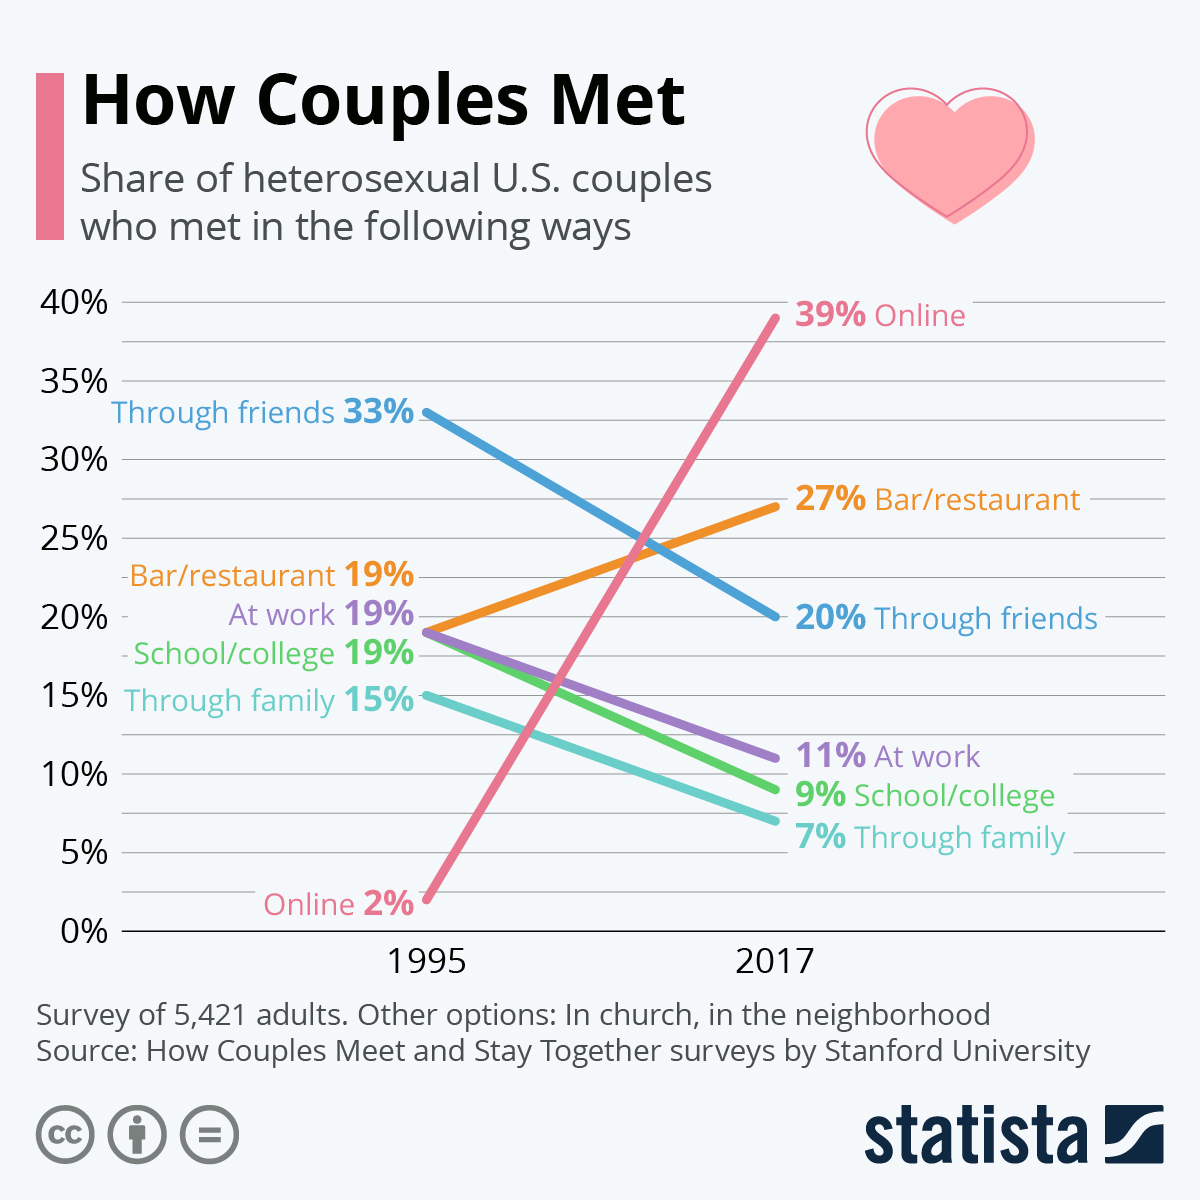
Through family? Alabama, you can do better than 7%..
Seems the main difference is the OP graph has straight couples meeting in a bar going up and the one you linked shows a fall for all couples.
I would conclude that more straights hooked up in a bar while the non-heteros used apps to make sure the person they were hitting on was like-minded.
I think it's probably true that non-straight couples meet up online most of the time. But I also don't think that that demographic would have much sway on the graph at all. Only 7.1% of adults in the U.S. identify as LGBT, despite the skewed demographics online.
Data Is Beautiful
A place to share and discuss data visualizations. #dataviz
