122
you are viewing a single comment's thread
view the rest of the comments
view the rest of the comments
this post was submitted on 03 Aug 2026
122 points (99.2% liked)
Climate
8874 readers
564 users here now
Discussion of climate, how it is changing, activism around that, the politics, and the energy systems change we need in order to stabilize things.
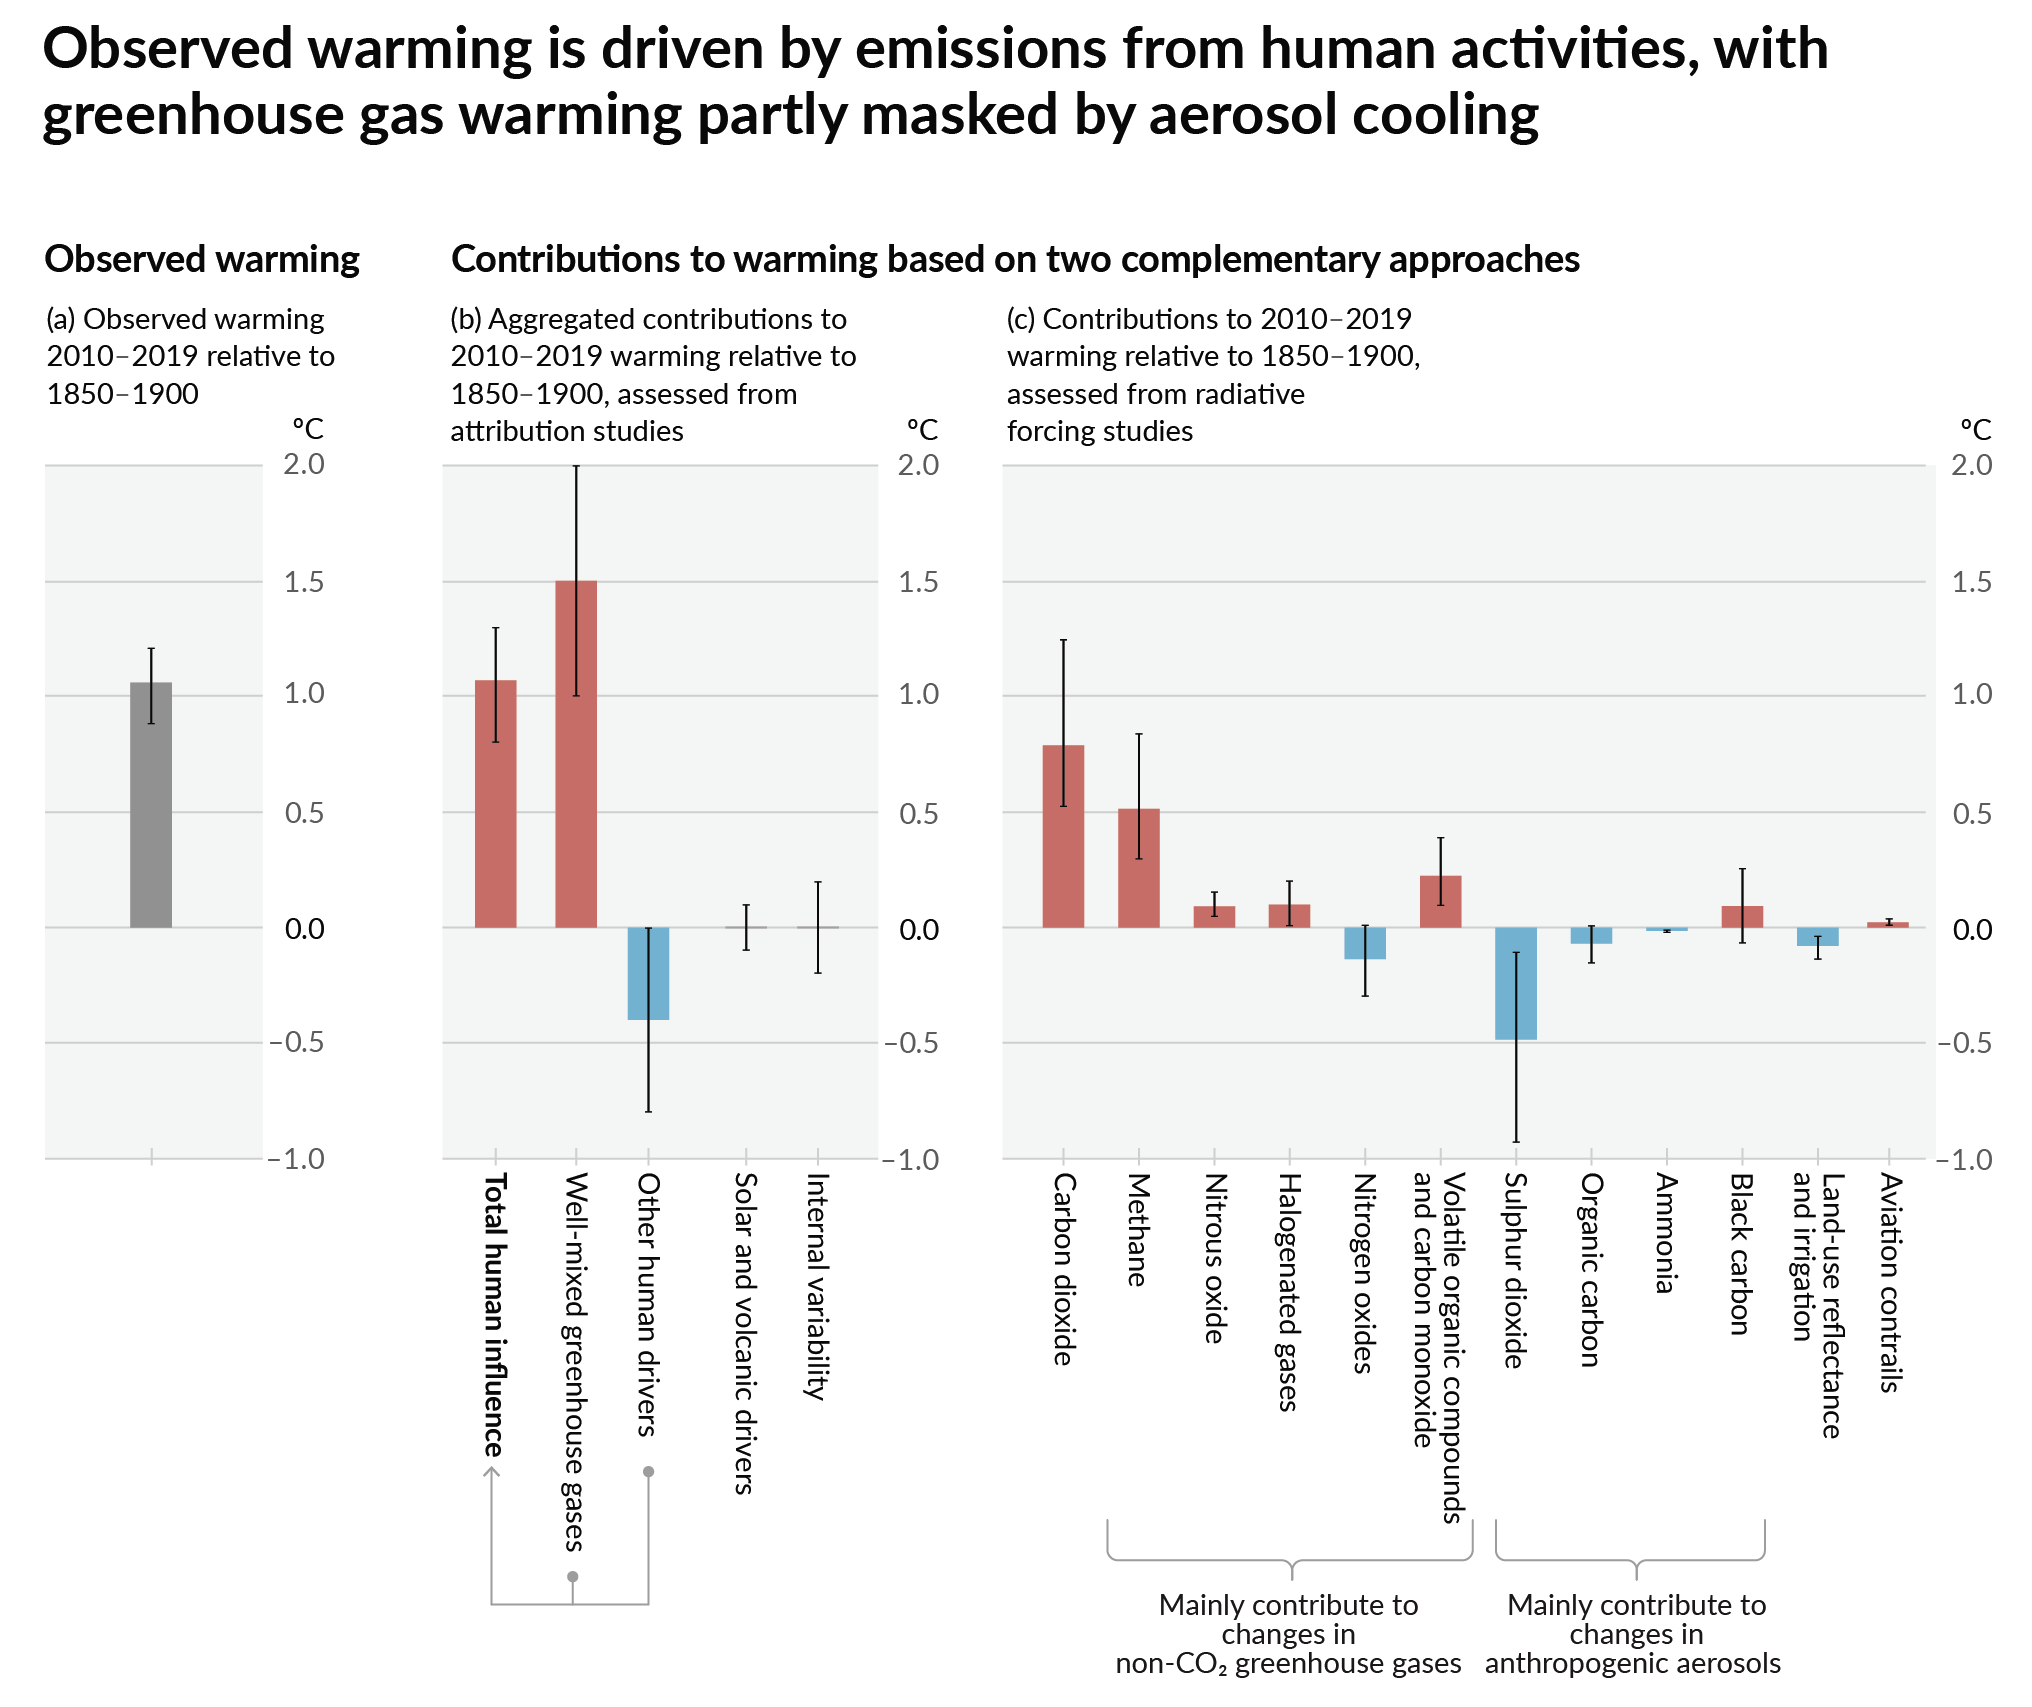
As a starting point, the burning of fossil fuels, and to a lesser extent deforestation and release of methane are responsible for the warming in recent decades:
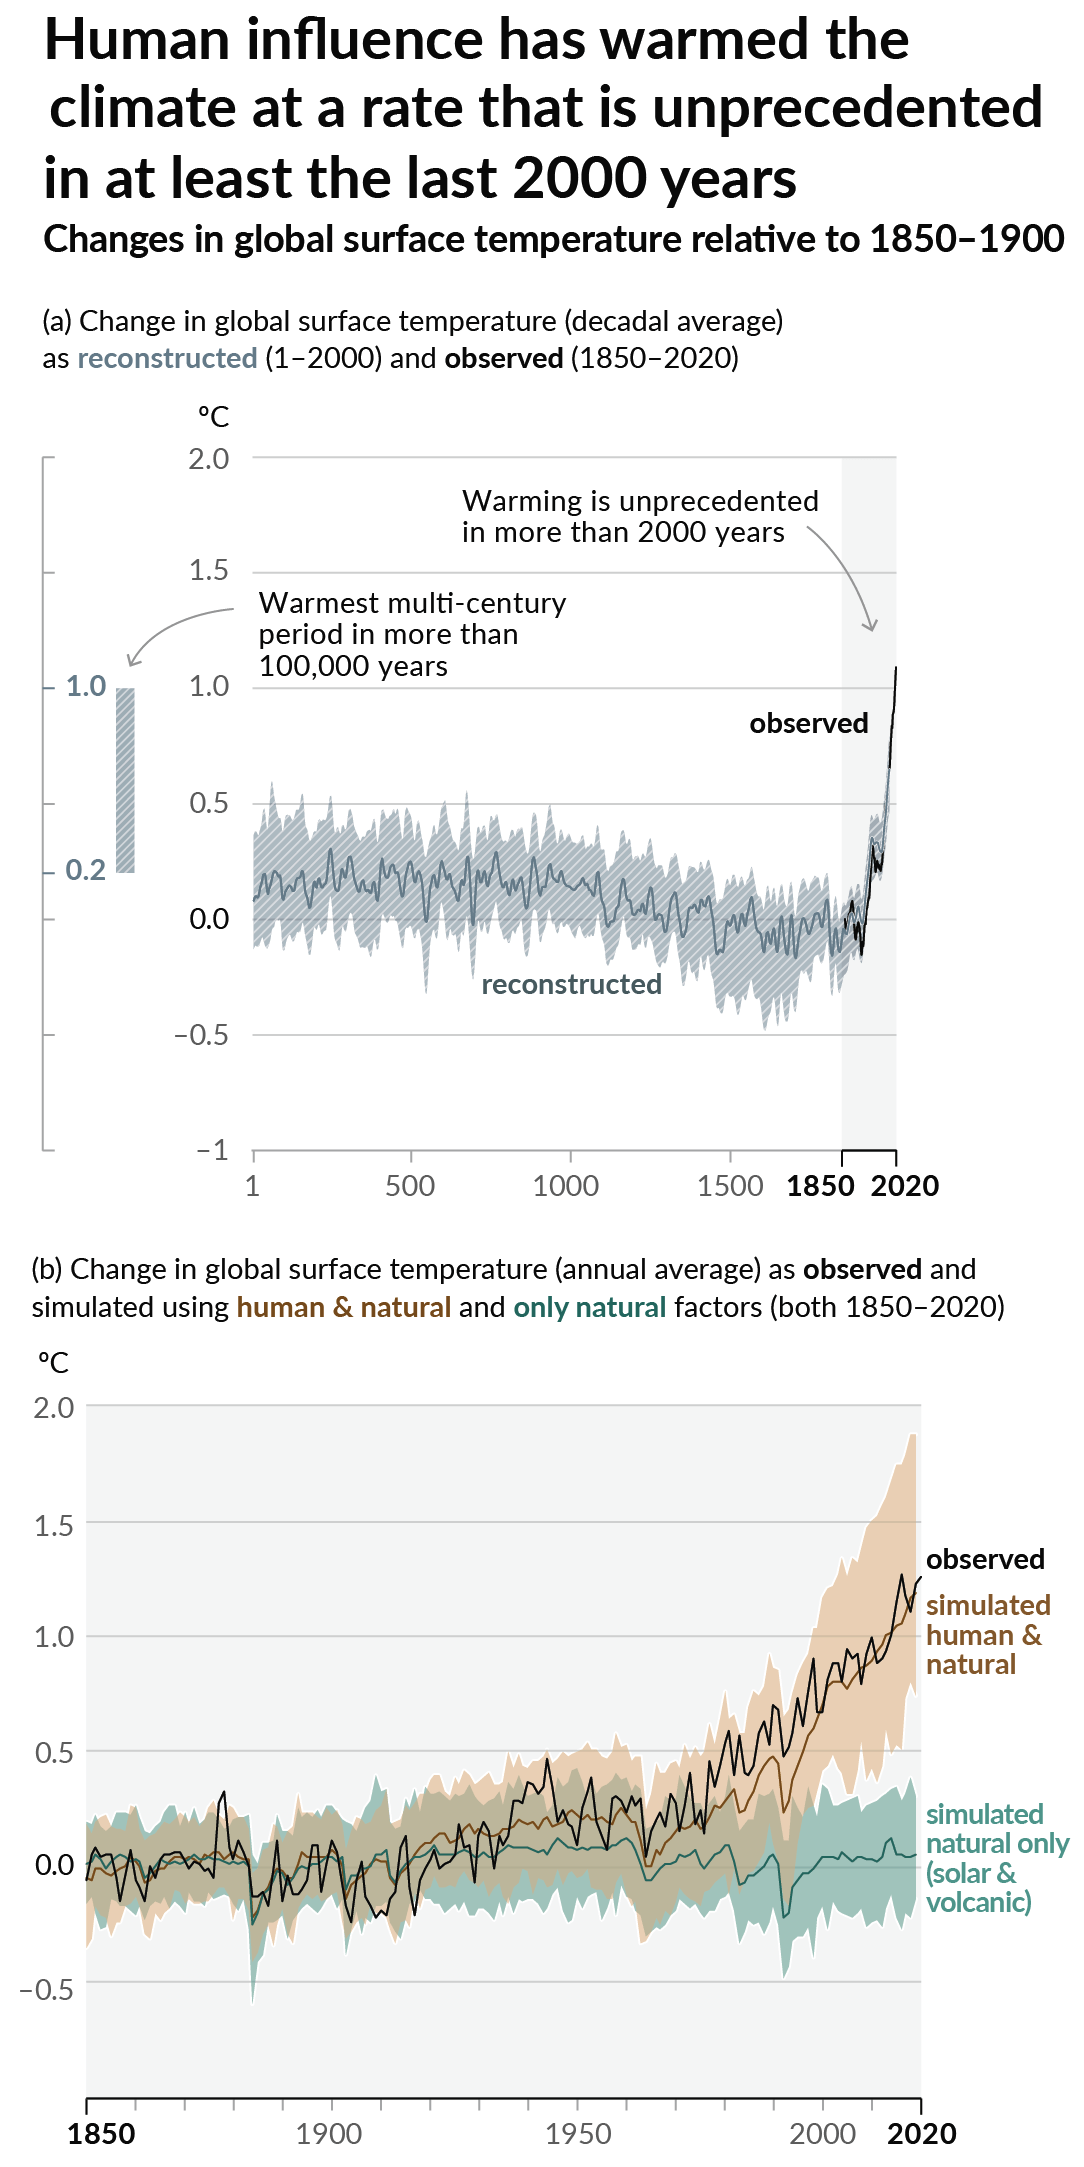
How much each change to the atmosphere has warmed the world:
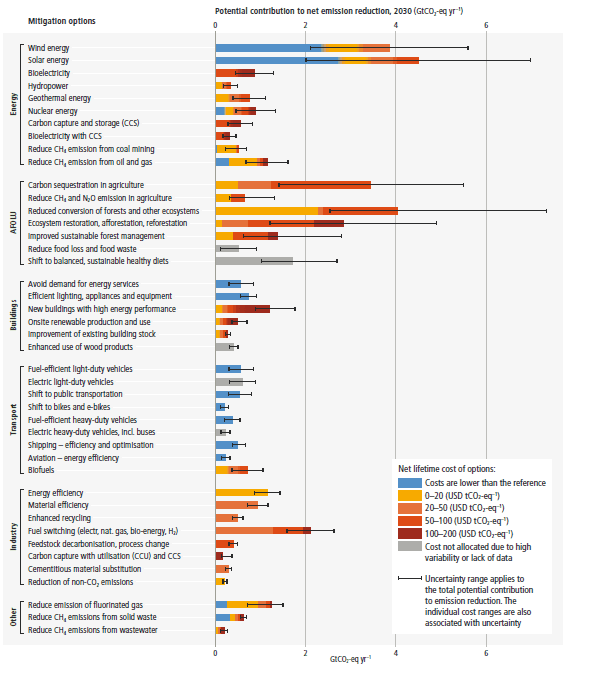
Recommended actions to cut greenhouse gas emissions in the near future:
Anti-science, inactivism, and unsupported conspiracy theories are not ok here.
founded 3 years ago
MODERATORS
I'm left with a lot of questions though, as the scope of the article is quite limited.
Short-haul flight are banned, so the gains seem obvious. But the article doesn't seem to detail if they're actually substituted by rail. Travellers could also be going by car, search for destinations further away, maybe not go at all.
I guess it's quite hard to find an actual effect from a broader perspective, but if their expectations are true, travellers using rail should have a noticable increase. It's a shame this is missing in the article.
Basically the article is saying that if you scrap a bunch of flights, emissions by aviations go down. Maybe I'm missing the point, but that seems pretty obvious. I'd like to know what the actual broader effect is of these measures taken.
Cars are still roughly an order of magnitude less emitting for the same trip compared to planes so in the worst case it's still a win, as long as it doesn't increase public subsidization of car-centric infrastructure. I think I would personally take rail if I were presented with car or train. I can at least do something while riding the train or even work remotely or something.