18
How many people does heat actually kill? It depends on how you count it
(www.theclimatebrink.com)
Discussion of climate, how it is changing, activism around that, the politics, and the energy systems change we need in order to stabilize things.
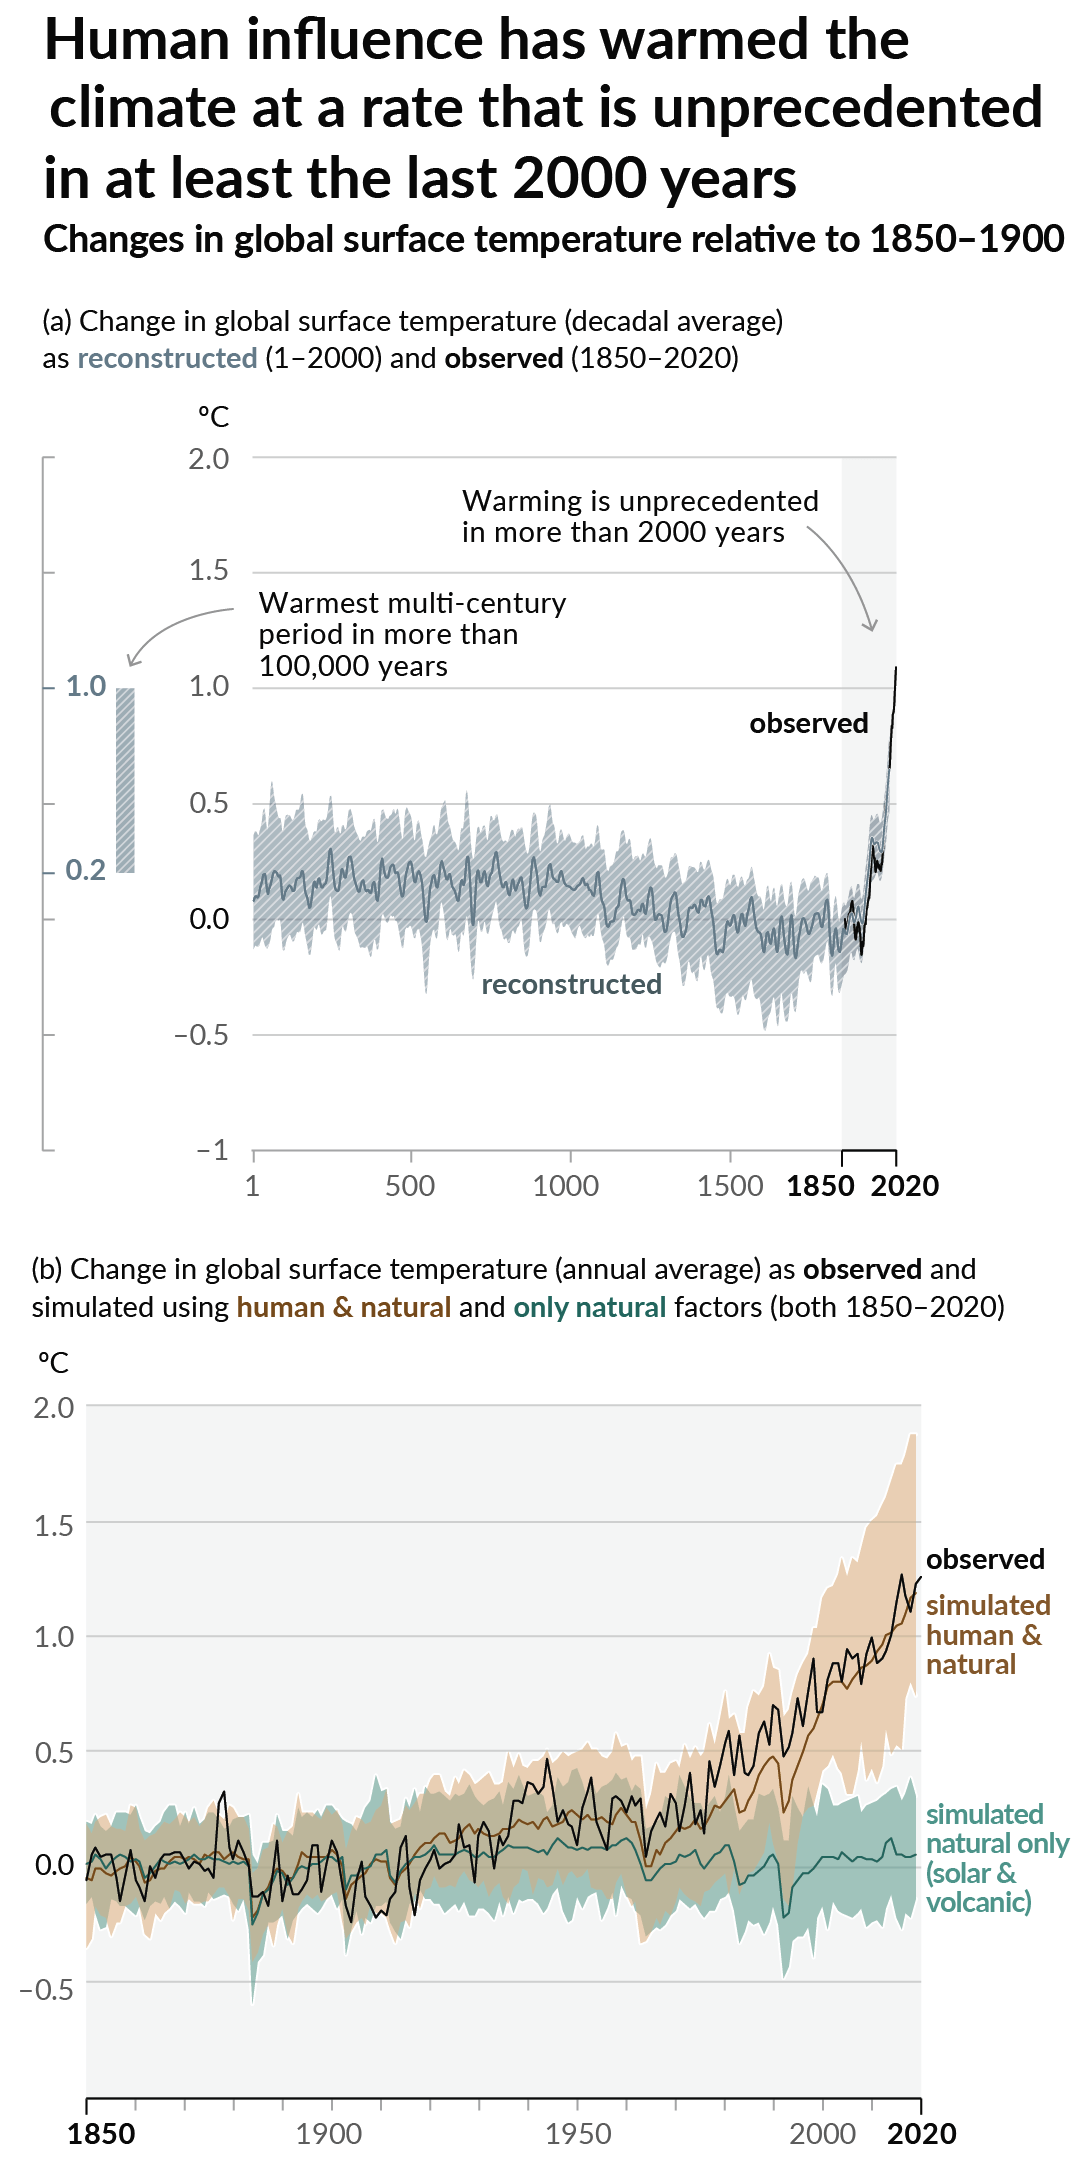
As a starting point, the burning of fossil fuels, and to a lesser extent deforestation and release of methane are responsible for the warming in recent decades:
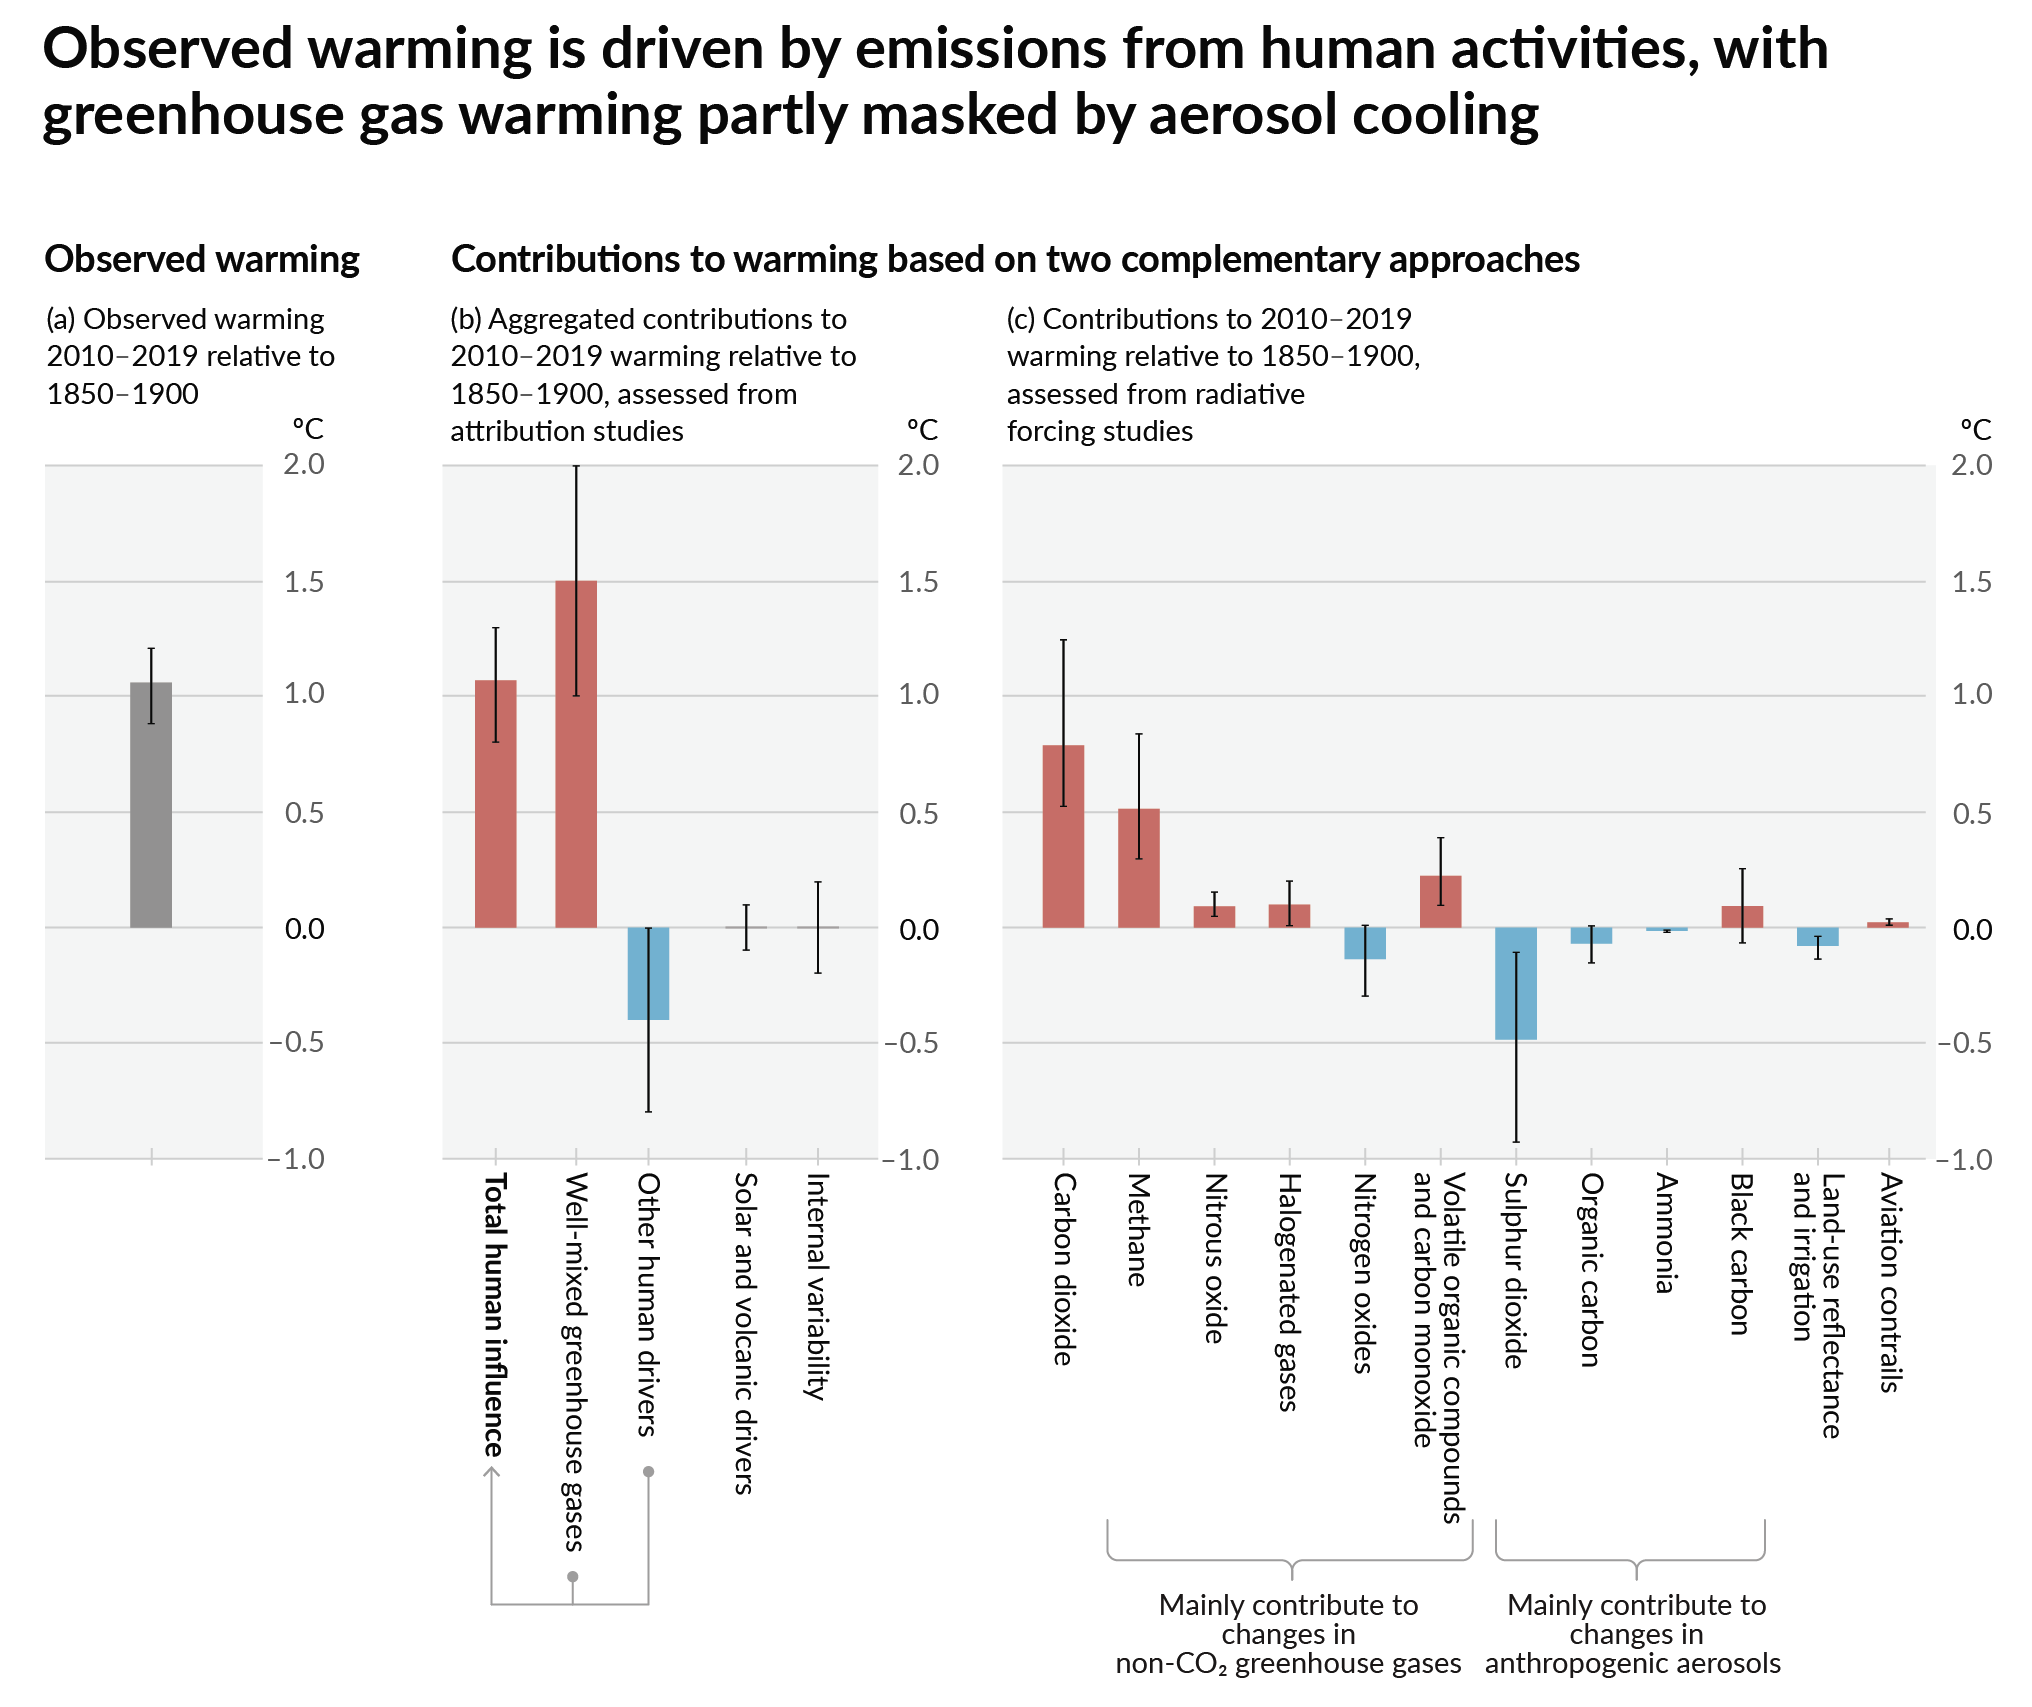
How much each change to the atmosphere has warmed the world:
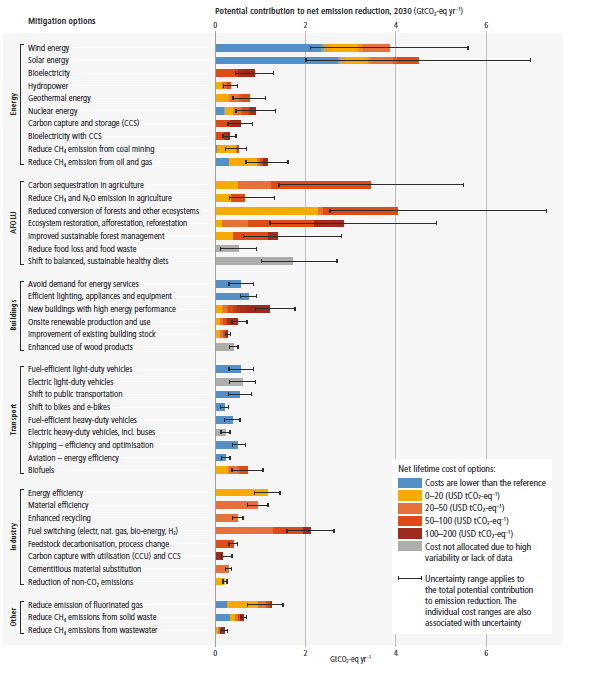
Recommended actions to cut greenhouse gas emissions in the near future:
Anti-science, inactivism, and unsupported conspiracy theories are not ok here.
not doubting it, but do you have anything to backup the first point about heat only killing those who were days/months from death already?
You won't get an answer because he's wrong. This link shows some stats about heat stroke in America. People under 5 years old die at a rate of 190 per 100k, the it craters to 27 per 100k from 5 to 14 and keeps climbing from there, peaking for those between 55 and 64. Note that deaths between 35 and 44 are more than half that of the cohort most likely to die of heat stroke, not people you wouldn't consider in their best condition.
Everything about that chart says that unmanaged heat is very dangerous and as we get older it gets harder to handle, at least once we are over the age of 5 and our heat regulation mechanisms have matured.
This is the same excuse anti-vaxxers use for why it's okay that children and old people die from the flu. "The flu isnt dangerous, it only kills the ones who are too weak to survive." Of course, kids who don't die of the flu live just fine for decades, whether they avoid doing so by luck or vaccination, and while seniors won't necessarily live for decades if they avoid the flu or heat stroke, they can still live for years. Here's an abstract talking about morbidity for people over 80. 23.9% mortality for those without the flu vaccine vs 20.9% for those with, for total morbidities. There is a significant reduction in all morbidities if these really old people just don't get the flu.