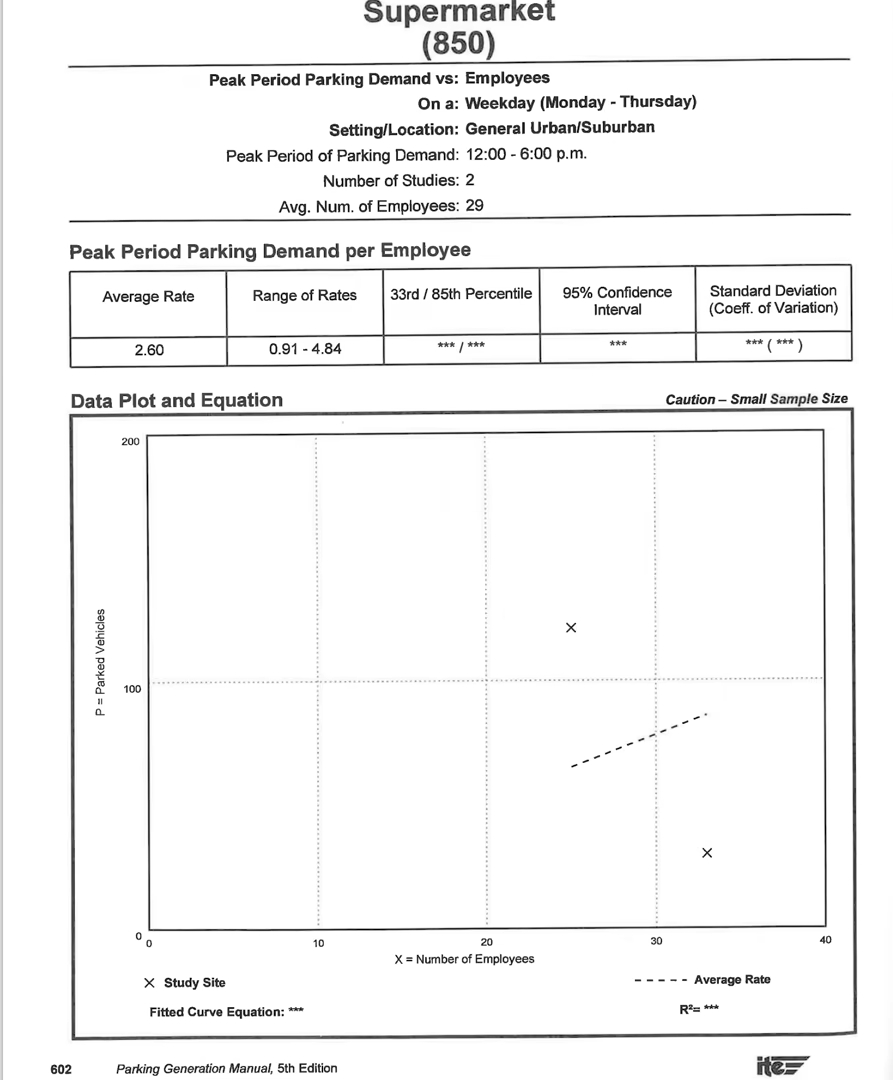
Relevant xkcd
post
Unless you're in a college statistics course, then if your line is off by a pixel your grade drops a full letter.
If you're in a college statistics course and you're doing graphs by hand and not generated entirely be statistics software, the skills you're learning are useless anyway.
My bitterness lingers from the 90s.
To be fair, I'm snarky because plenty of colleges (and way too many high schools) still do this shit because it's not about the knowledge, it's about the signalling to employers that the student will make a good cog in their machine.
To anyone struggling in a stats course: real data science is programming, not math. If you're on Lemmy there is a good chance you're a better data scientist than your hack of a teacher.
...my stats professor is a programmer, though. Are you not talking about high level statistics courses? A lot has changed since R and Rstudio has been developed. (It's FOSS!). All of my assignments are either proofs in LaTeX or questions that involve programming.
( If you're in a stats course and using excel, you are learning stats for babies. Your class has business majors in it.)
Memories of my professor in early 2010s teaching us to do it by hand in case the power at work ever goes out and we don't wanna get fired ...... based on his 90s work experience.
He was fun though.
And make sure you use linear regression, nobody thinks linear regression is bad.
Yeah that would be bad practice, industry standard is to run all the tests simultaneously and if something comes out statistically significant make up a narrative then try to split it into 4 papers.
Folks in observation and analytics are gonna be real mad when they realize you're giving away their secrets.
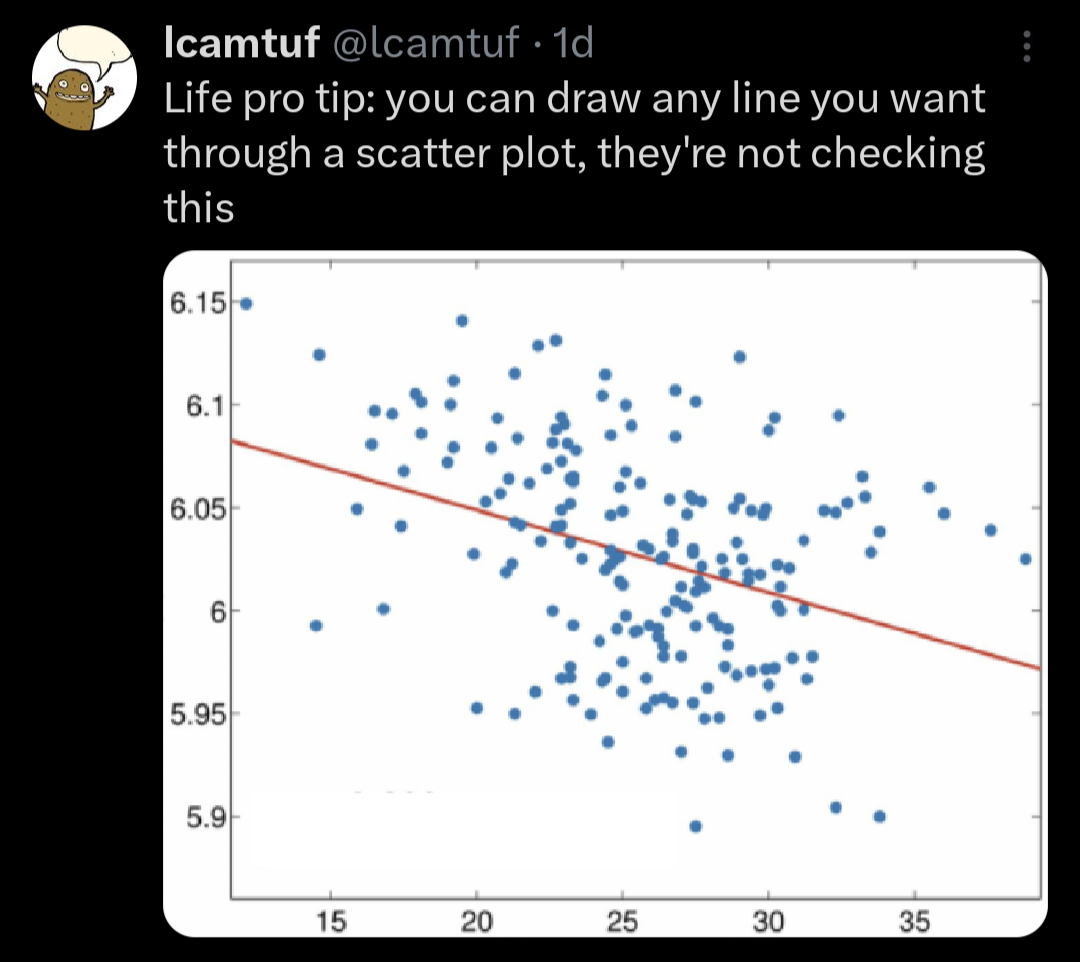
Just saw the scatter plot and line and my mind immediately screamed "bullshit" without knowing what this was about at all. Only then I read the text.
Look at that choice of axis scale tho
What's the r² on this, like ... 0.3 ish?
Less?
My guess is lower. I'd put the correlation at about -.35 to -.45, so that'd correspond to an R² of .1225 to .2025. But eyeballing correlations is hard.
Assuming it's a correction line, I don't think you can tell from the slope of that line alone as the clustering will matter and correlations are finicky. Now, if it was a regression coefficient, that sexy line can be calculated just by looking at it (although we'd want to know if it was significant, lol).
Delete enough data points and it will be 1. You'll only have two data points, but you'll have bragging rights.

all 26 comments