1
26

Nearly half of children in the United States are breathing dangerous levels of air pollution, according to a new report, as experts warned Donald Trump’s expansive rollback of protections will make the situation worse…

…The report further found that communities of color are disproportionately exposed to unhealthy air. As a result, they are more likely to live with one or more chronic health conditions that make them more vulnerable to pollution, including asthma, diabetes, and heart disease…

…Since returning to office last year, the Trump administration has initiated at least 70 actions to roll back environmental and climate protections. Among them is the loosening of regulations on power plants that limit mercury and other hazardous air toxics.

2
18

Climate Central analyzed average annual temperature trends since 1970 in 49 states and 242 U.S. cities to understand how temperatures across the country have changed as heat-trapping pollution has continued to climb.

The fastest-warming U.S. states from 1970 to 2025 are:

  • Alaska
  • New Jersey
  • New Mexico
  • Delaware
  • Massachusetts
  • Vermont

The fastest-warming U.S. cities are:

  • Reno, NV
  • Las Vegas, NV
  • El Paso, TX
  • Burlington, VT
  • Tyler, TX

This Climate Matters analysis is based on open-access data from the National Oceanic and Atmospheric Administration (NOAA). See Methodology for details.

3
22
submitted 5 hours ago by silence7@slrpnk.net to c/climate@slrpnk.net
4
85
submitted 7 hours ago by silence7@slrpnk.net to c/climate@slrpnk.net

A WIRED review of permits for data center projects using natural gas and linked to OpenAI, Meta, Microsoft, and xAI shows they could emit more than 129 million tons of greenhouse gases per year.

Archived copy of the article

5
29
submitted 6 hours ago by silence7@slrpnk.net to c/climate@slrpnk.net
6
30
submitted 6 hours ago by silence7@slrpnk.net to c/climate@slrpnk.net
7
23
submitted 6 hours ago by silence7@slrpnk.net to c/climate@slrpnk.net
8
20
submitted 6 hours ago by silence7@slrpnk.net to c/climate@slrpnk.net
9
16
submitted 6 hours ago* (last edited 6 hours ago) by silence7@slrpnk.net to c/climate@slrpnk.net

The paper is here

10
26
submitted 7 hours ago by silence7@slrpnk.net to c/climate@slrpnk.net
11
20
A few signs of hope for Earth Day (messaging-custom-newsletters.nytimes.com)
12
257
13
43

Advocates expressed alarm as new project drills deeper into ocean bed, pointing to company’s failures at Deepwater Horizon spill

14
15

This post uses a gift link with a view count limit. When it runs out, there is an archived copy of the article

15
22

Archived copies of the article:

16
28
17
23
18
10

This post uses a gift link with a view count limit. When it runs out, there is an archived copy of the article

19
20
20
21

The annual number of weather disasters inflicting $1 billion or more in damage has risen fivefold since the turn of the century, adjusted for inflation. Some of this is due to people rushing like lemmings into disaster-prone areas. But much of it is a result of the rising frequency and destructiveness of these events because of climate change.

21
22
22
155
23
12

A new "working-class climate agenda" seeks to provide economic relief and tackle global warming at the same time.

24
11
25
8

"There are going to be times that are very, very hard, and we are in one of them. And we have to keep going with passion, dogged determination, and belief that we can make the impossible possible."

view more: next ›

Climate

8565 readers
357 users here now

Discussion of climate, how it is changing, activism around that, the politics, and the energy systems change we need in order to stabilize things.

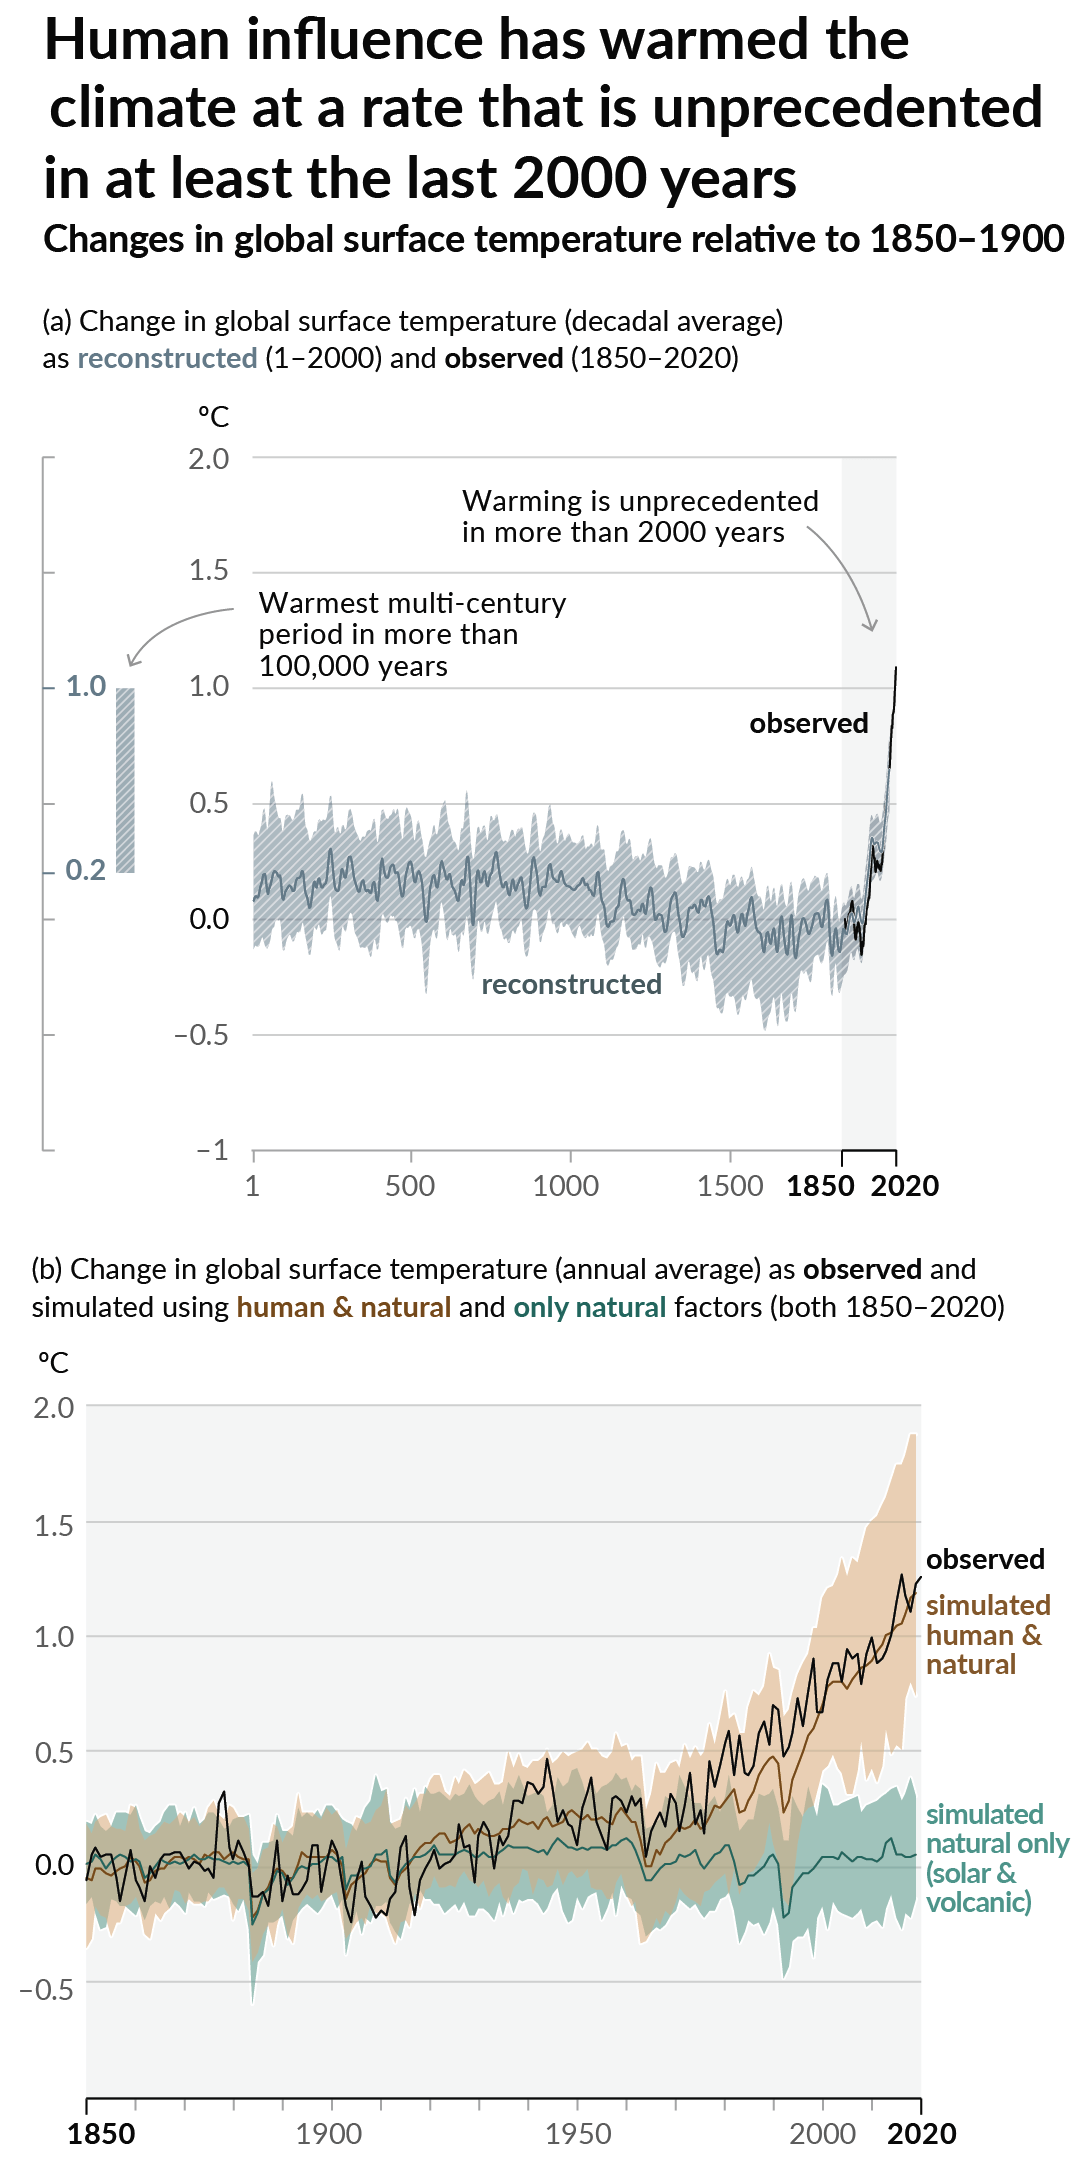
As a starting point, the burning of fossil fuels, and to a lesser extent deforestation and release of methane are responsible for the warming in recent decades: Graph of temperature as observed with significant warming, and simulated without added greenhouse gases and other anthropogentic changes, which shows no significant warming

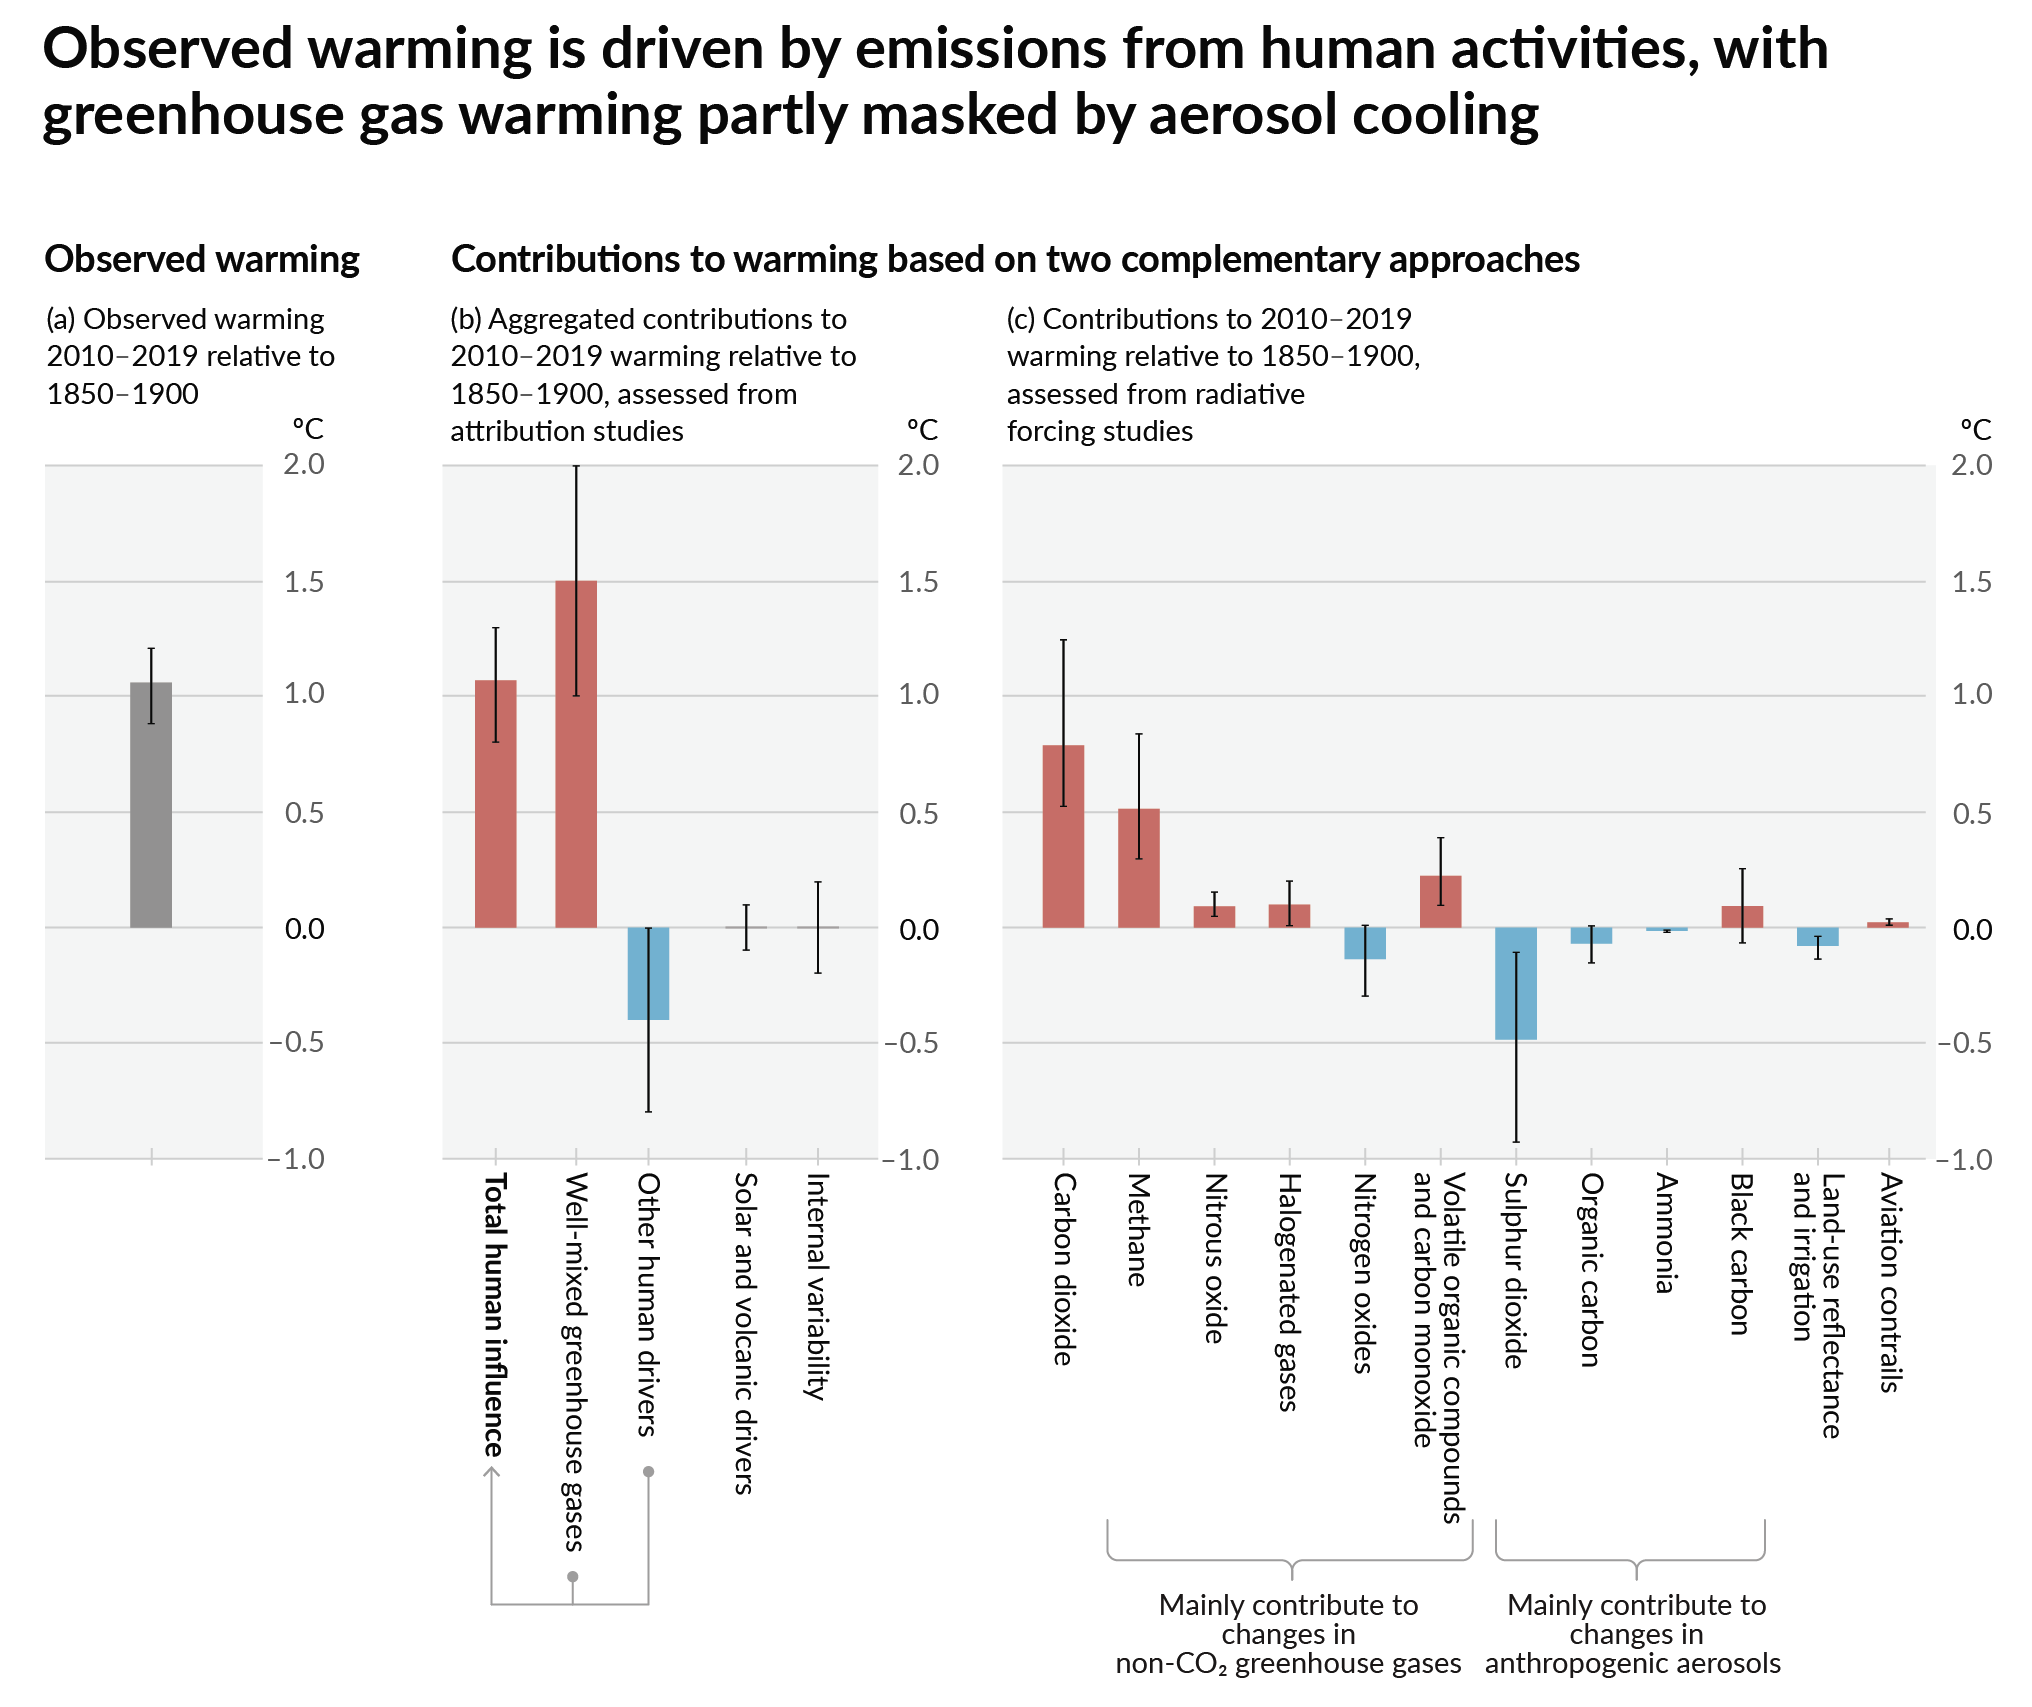
How much each change to the atmosphere has warmed the world: IPCC AR6 Figure 2 - Thee bar charts: first chart: how much each gas has warmed the world.  About 1C of total warming.  Second chart:  about 1.5C of total warming from well-mixed greenhouse gases, offset by 0.4C of cooling from aerosols and negligible influence from changes to solar output, volcanoes, and internal variability.  Third chart: about 1.25C of warming from CO2, 0.5C from methane, and a bunch more in small quantities from other gases.  About 0.5C of cooling with large error bars from SO2.

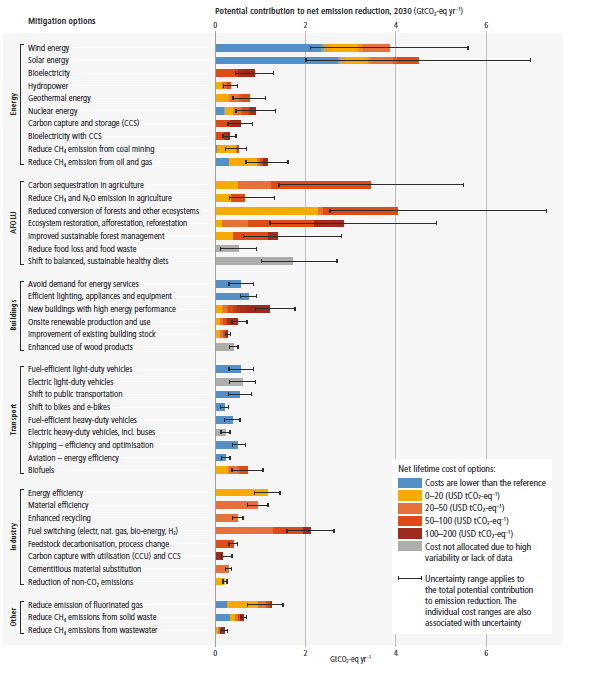
Recommended actions to cut greenhouse gas emissions in the near future:

Anti-science, inactivism, and unsupported conspiracy theories are not ok here.

founded 2 years ago
MODERATORS