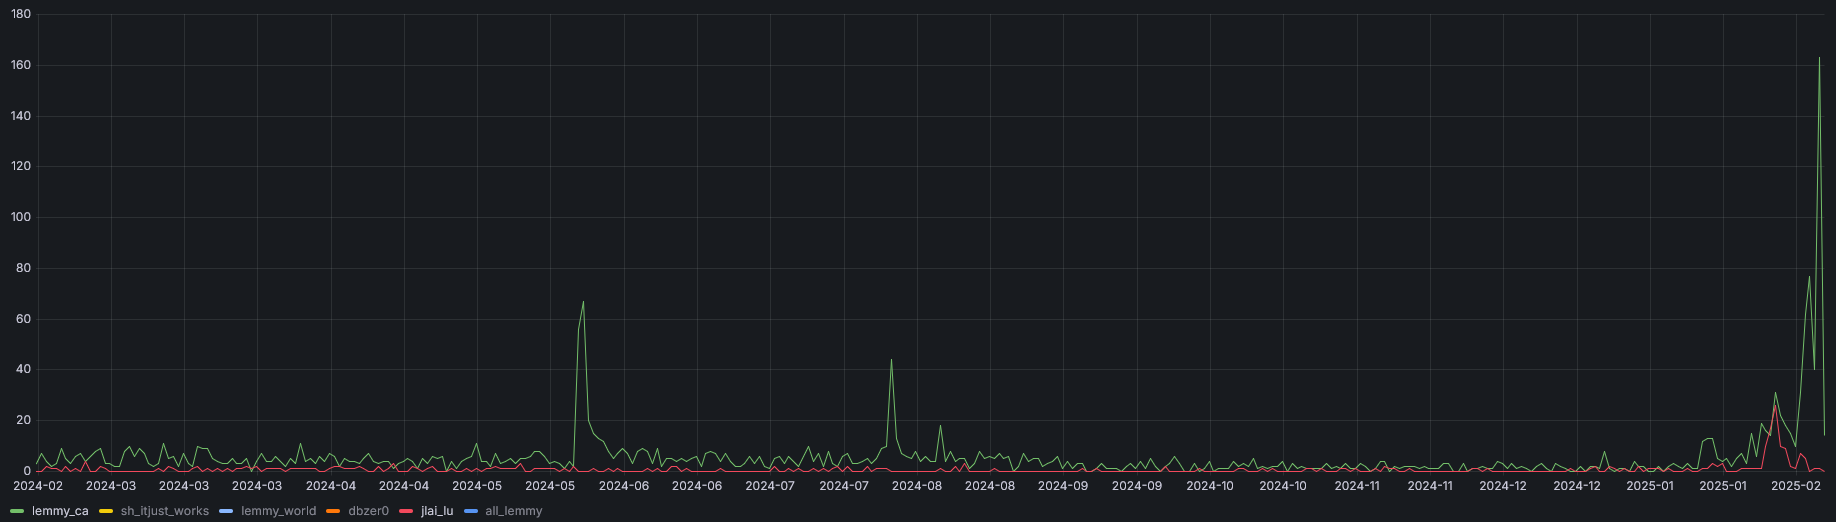
They must be those cool folks from r/onguardforthee and r/fredericton! Lets get off those american Reddit servers eh!
Update: there’s a thread on r/buycanadian with 93 upvotes, promoting the platform! Open the floodgates baby!

They must be those cool folks from r/onguardforthee and r/fredericton! Lets get off those american Reddit servers eh!
Update: there’s a thread on r/buycanadian with 93 upvotes, promoting the platform! Open the floodgates baby!
No, I want to start exposing a grafana instance but for now I'm keeping this internal since it hits our live postgres.
The query if you want it is:
SELECT
  DATE(published AT TIME ZONE 'UTC') AS date,
  COUNT(*) FILTER (WHERE instance_id IN (SELECT id FROM instance WHERE domain = 'lemmy.ca')) AS lemmy_ca,
  COUNT(*) FILTER (WHERE instance_id IN (SELECT id FROM instance WHERE domain = 'sh.itjust.works')) AS sh_itjust_works,
  COUNT(*) FILTER (WHERE instance_id IN (SELECT id FROM instance WHERE domain = 'lemmy.world')) AS lemmy_world,
  COUNT(*) FILTER (WHERE instance_id IN (SELECT id FROM instance WHERE domain = 'lemmy.dbzer0.com')) AS dbzer0,
  COUNT(*) FILTER (WHERE instance_id IN (SELECT id FROM instance WHERE domain = 'jlai.lu')) AS jlai_lu,
  count(*) as all_lemmy
FROM person
GROUP BY 1
ORDER BY 1;
Or here's your instance overlayed with us to provide a comparison: