all 15 comments

sorted by: hot top controversial new old
[–] 42 points 2 years ago (2 children)

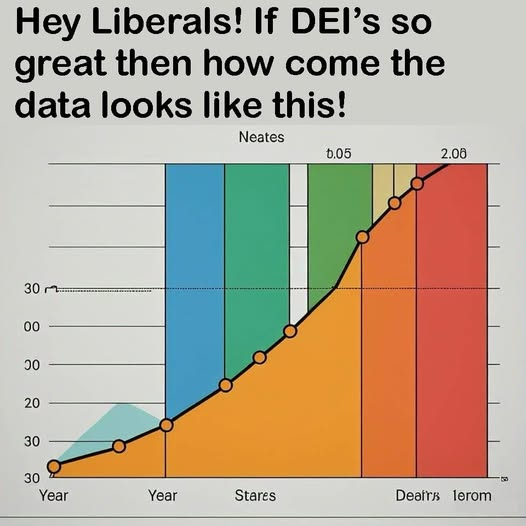
What even is this supposed to represent?

  • source
  • hideshow 4 child comments
  • [–] 73 points 2 years ago (2 children)

    Looks like somebody asked an LLM to generate a bullshit graph...

    What may be its optimal application!

  • source
  • parent
  • hideshow 4 child comments
  • [–] 34 points 2 years ago

    Ah, yes, I see the Year to Ierom ratio is heavily stacked in the Ierom end.

    Nice AI graph.

  • source
  • [–] 25 points 2 years ago (1 child)
  • [–] 18 points 2 years ago

    The trend is good because it goes up and like a right hand gesture. Graphs that go like the left hand are inefficient.

    - Elon.

  • source
  • [–] 16 points 2 years ago
    [–] 15 points 2 years ago

    This chart has too many colors.

    Gay.

  • source
  • [–] 12 points 2 years ago (1 child)

    We've had one year yes but what about second year?

  • source
  • hideshow 2 child comments
  • [–] 12 points 2 years ago (1 child)

    I immediately went to the y-axis to see how they normalized it, only to find well there really isn't much of a y-axis.

  • source
  • hideshow 2 child comments
  • [–] 2 points 2 years ago* (last edited 2 years ago)

    Yes this makes sense, the 20 below the lower 00 above 30 at the point of year is illuminating! Compared to stares, where it’s above the lower 00 already! At and after the unnamed point before deal’s we just let you guess the value, which makes perfect sense. It’s Neates after all. You can use the 0.05 as a hint!

  • source
  • parent