Fair enough. This is a version of the chart I've seen and had in mind. I suppose the difference is in relation to minimum wage.
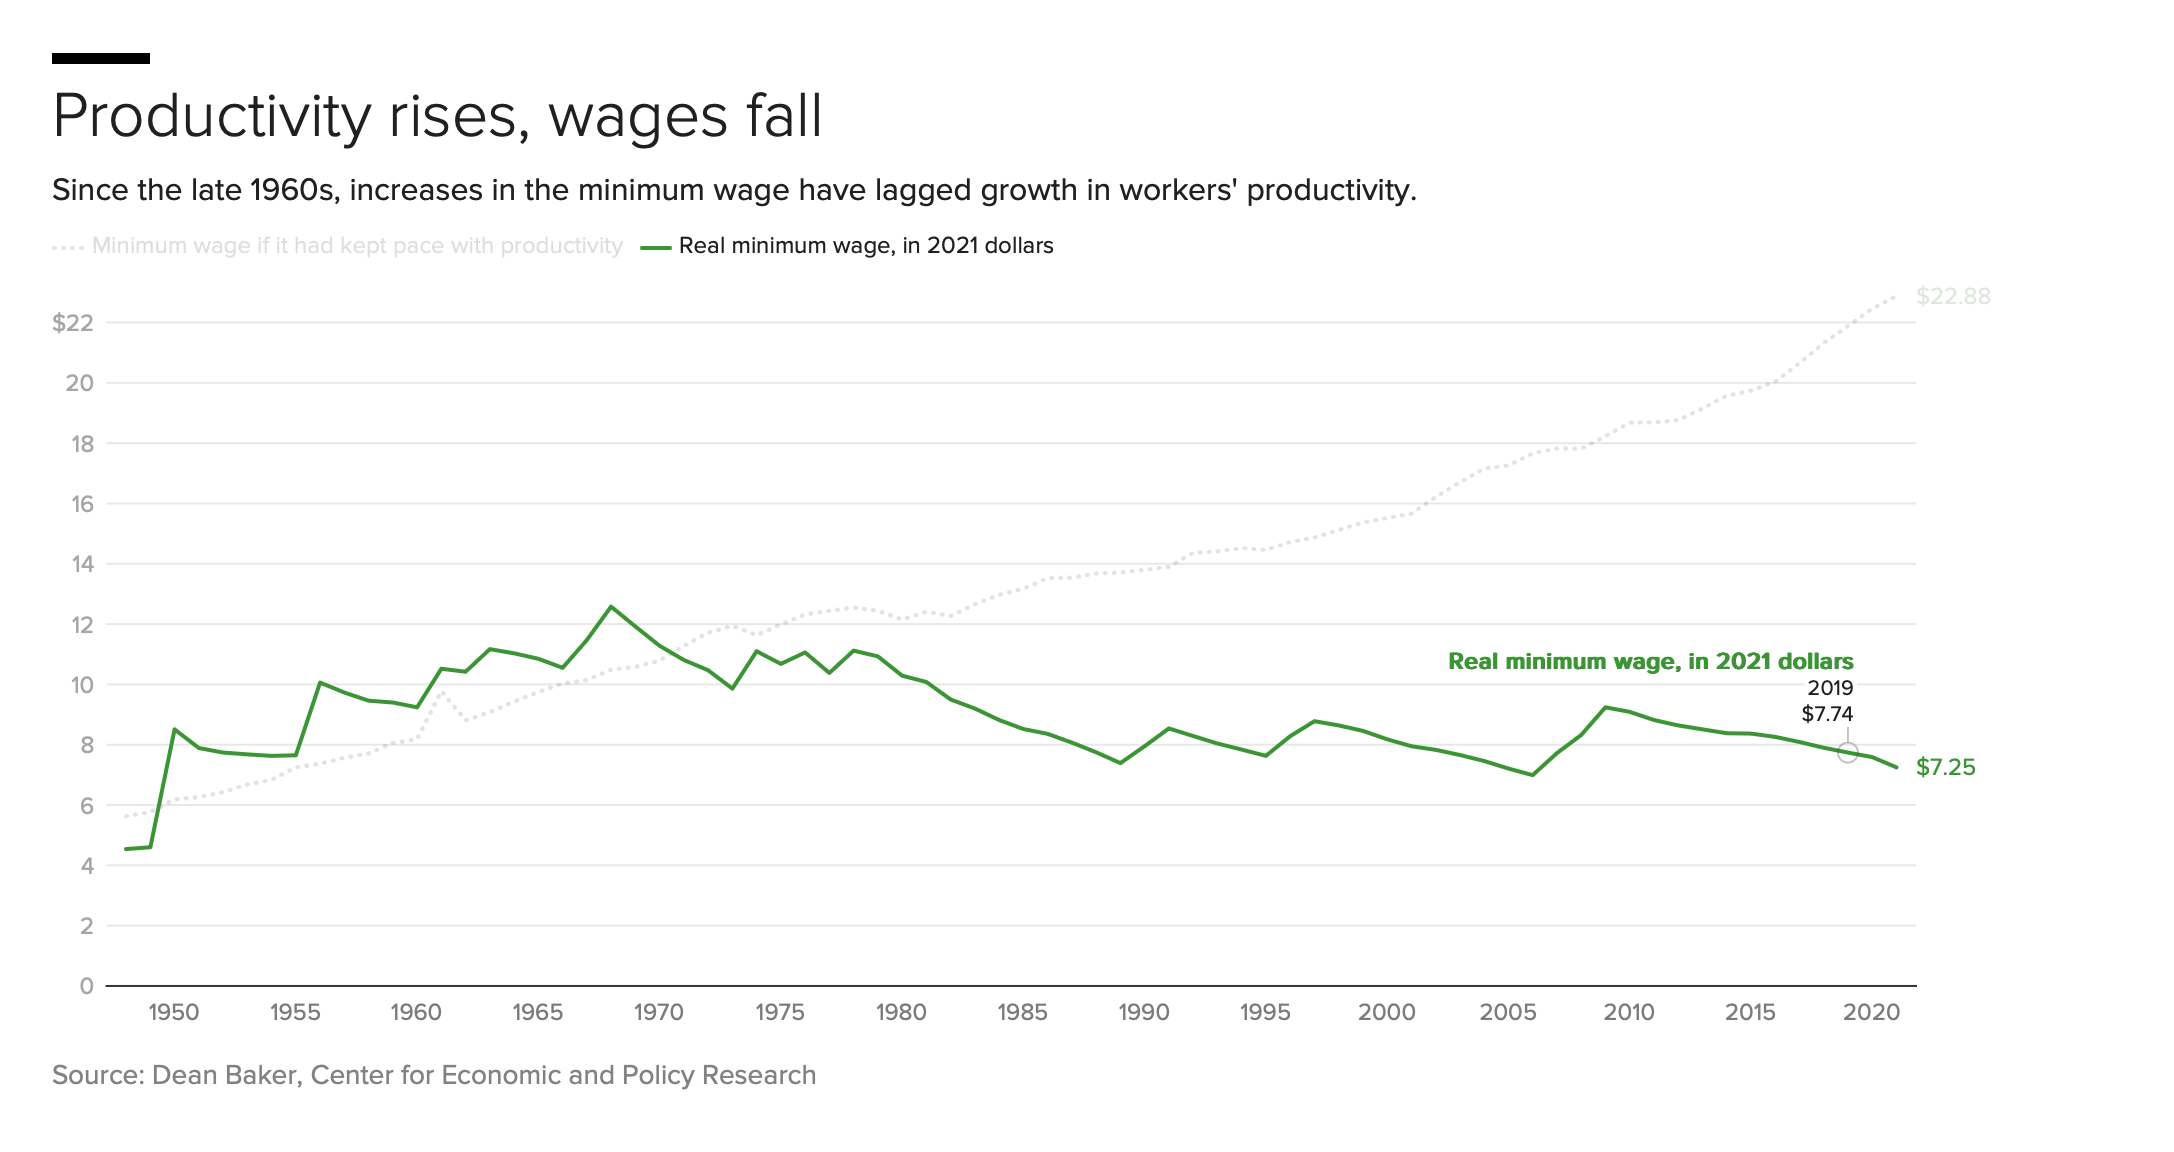
"We have seen that complete divorce between wages and productivity and massively increased inequality with most gains going to people at the top."
https://www.cbsnews.com/news/minimum-wage-26-dollars-economy-productivity/
"Purchasing power" is the metric I've been thinking about.
This decline in purchasing power means low-wage workers have to work longer hours now just to achieve the standard of living that was considered the bare minimum half a century ago.
https://www.epi.org/publication/raising-the-federal-minimum-wage-to-15-by-2024-would-lift-pay-for-nearly-40-million-workers/
Here specifically is the web page I've kept in mind when referring to productivity (and I admit that off the top of my head "the 70s" was a bit off).
In fact, had the federal minimum wage kept pace with workers’ productivity since 1968 the inflation-adjusted minimum wage would be $24 an hour.
https://aflcio.org/what-unions-do/social-economic-justice/minimum-wage
I concede that "young adults" and "low wage workers" shouldn't be confused.
I've edited my previous comment. Thank you for the point.