Located in London, I measured the RTT or round trip time to 574,691 random webservers and plotted the times on the globe.
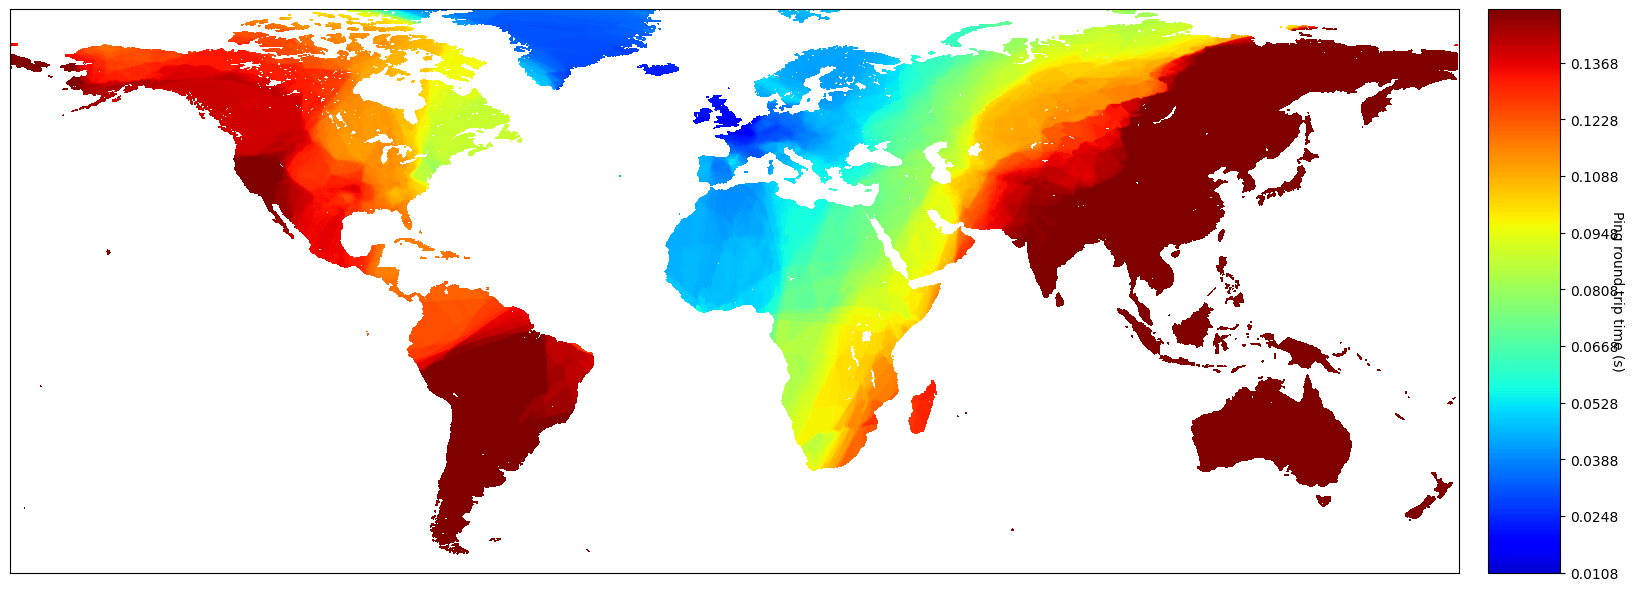
Discovery was done with masscan, measurements using hping and plotting with an old Python script I've revived and enhanced.

This is part of the next writeup on my blog, with which I will be posting any of the code I've used.

Full write-up and code

Blog / How I made a blog using Lemmy

you are viewing a single comment's thread
view the rest of the comments
[–] 8 points 1 year ago* (4 children)

Can you show different projections? Like one that keeps distances from you the same (countries will look very stretched at the far end but radial distances from you are preserved). It looks like the latency doesn't quite follow physical distance from you, but it's hard to tell because of the projection.

(Interesting map though, thank you!)

  • source
  • hideshow 4 child comments
  • [–] [S] 9 points 1 year ago (3 children)

    Azimuthal Equidistant Projection shows the equal distances, probably my favorite

    Mercator Projection is good too

  • source
  • parent
  • hideshow 3 child comments
  • [–] 4 points 1 year ago (2 children)

    Thanks!

    Is that Azimuthal projection centred on London though? It looks like it's centred in Africa but maybe that's just because the top-left is cropped off because it's all ocean?

  • source
  • parent
  • hideshow 2 child comments