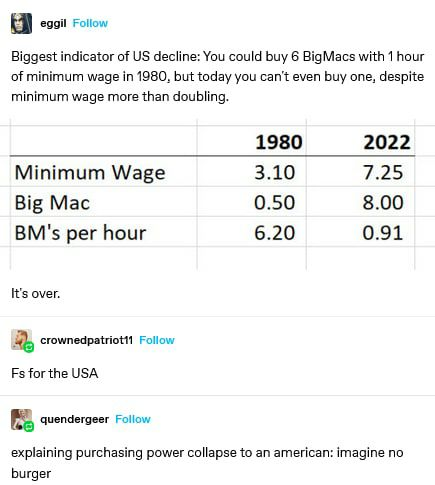
The Big Mac index is a pretty good indicator of purchasing power. Despite this Big Macs were not $0.50 in 1980, they were closer to $1.75. Still a significant change. Also, the price of a Big Mac changes between states, ranging from $3.75 to $6.39 in 2022.. If you follow that last link and use the minimum wages given to do some division they're really not as different as presented, which is interesting.